Bitcoin Price Forecast: Recent rally fuels “Uptober” hopes

Bitcoin price today: $67,000
- Bitcoin demand appears to be picking up, according to a CryptoQuant report.
- BTC’s performance since the fourth halving closely resembles that of the third halving, when prices increased sharply.
- US Bitcoin Spot ETFs recorded a third straight day of inflows on Wednesday.
Bitcoin (BTC) is trading slightly down around $67,000 on Thursday after a 7.5% rally since Monday. CryptoQuant’s weekly report supports continued upward momentum for the main crypto asset, highlighting the increasing demand for BTC in a week in which US-listed spot ETFs have registered inflows for three consecutive days. Rising demand and reports pointing that BTC price could further increase have fuelled optimism around the “Uptober” narrative, as October has traditionally been a strong month for investors.
Bitcoin demand appears to be returning
CryptoQuant, an on-chain and market data analytics firm, published a weekly report on Wednesday highlighting the return of Bitcoin demand.
The report points to a resurgence in Bitcoin demand, with current apparent demand reaching 177,000 BTC. As shown in the graph below, this has historically preceded significant price rallies to new record highs in 2020-2021 and 2024, suggesting that a further increase in demand is essential for a sustainable move toward new all-time highs.
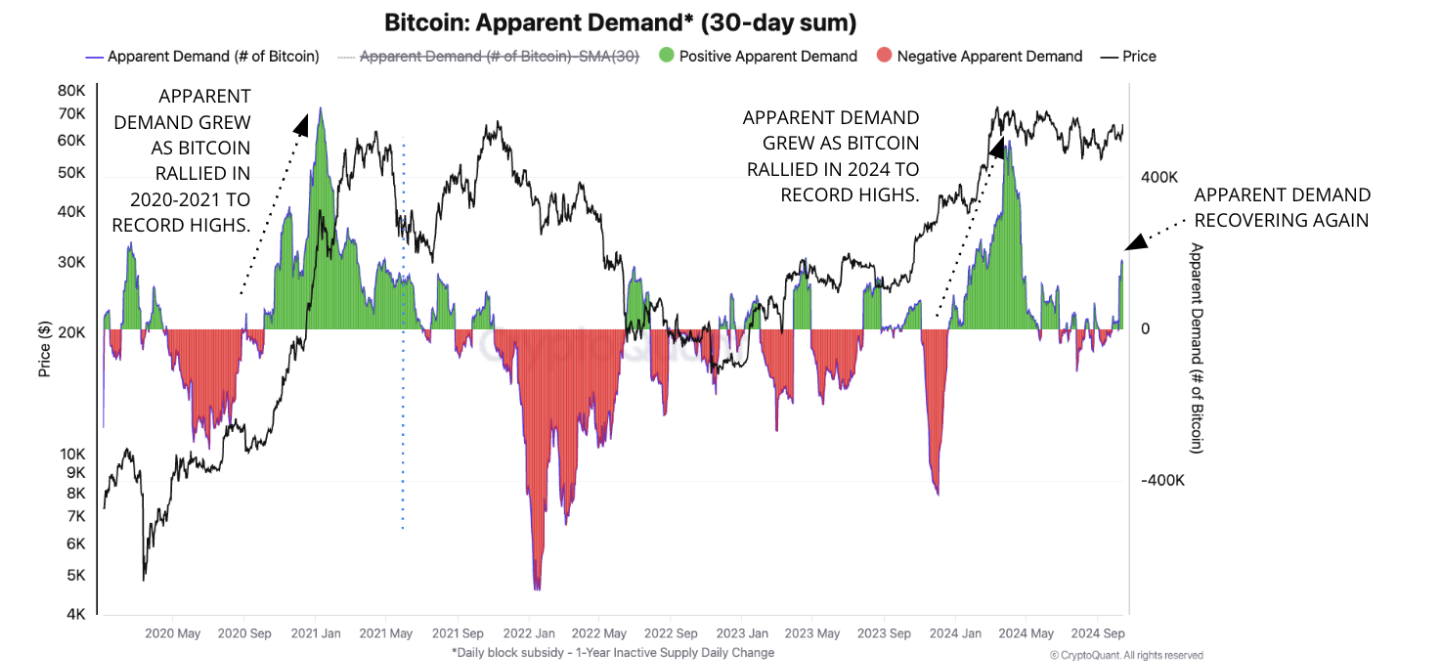
Bitcoin Apparent Demand chart. Source: CryptoQuant
According to the analyst, other large investors continue accumulating Bitcoin. The total balance of Bitcoin whales, excluding exchanges and mining pools, has expanded compared with the previous year, growing to 670,000 Bitcoin. Moreover, the growth of holdings stands above its 365-day moving average, a positive sign for prices.
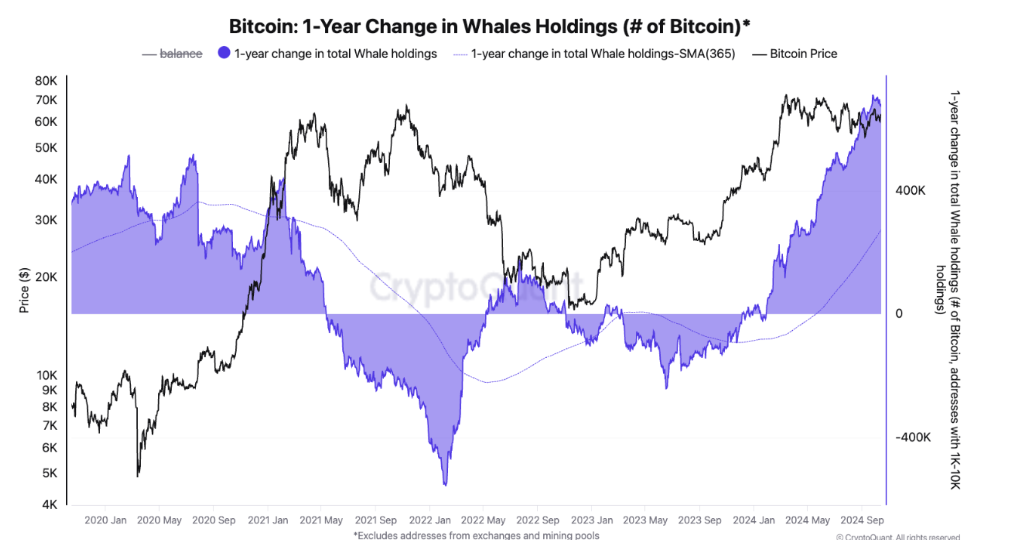
Bitcoin 1-Year Change in Whales Holdings chart. Source: CryptoQuant
Lastly, the report explains that Bitcoin remains in a period of positive seasonal performance. The price of Bitcoin typically performs well in Q4, when in a bull cycle and particularly in a halving year. In the halving years of 2012, 2016, and 2020, the price of Bitcoin increased by 9%, 59%, and 171%, respectively. So far, in Q4 2024, Bitcoin is behaving very similarly to 2016 and 2020.
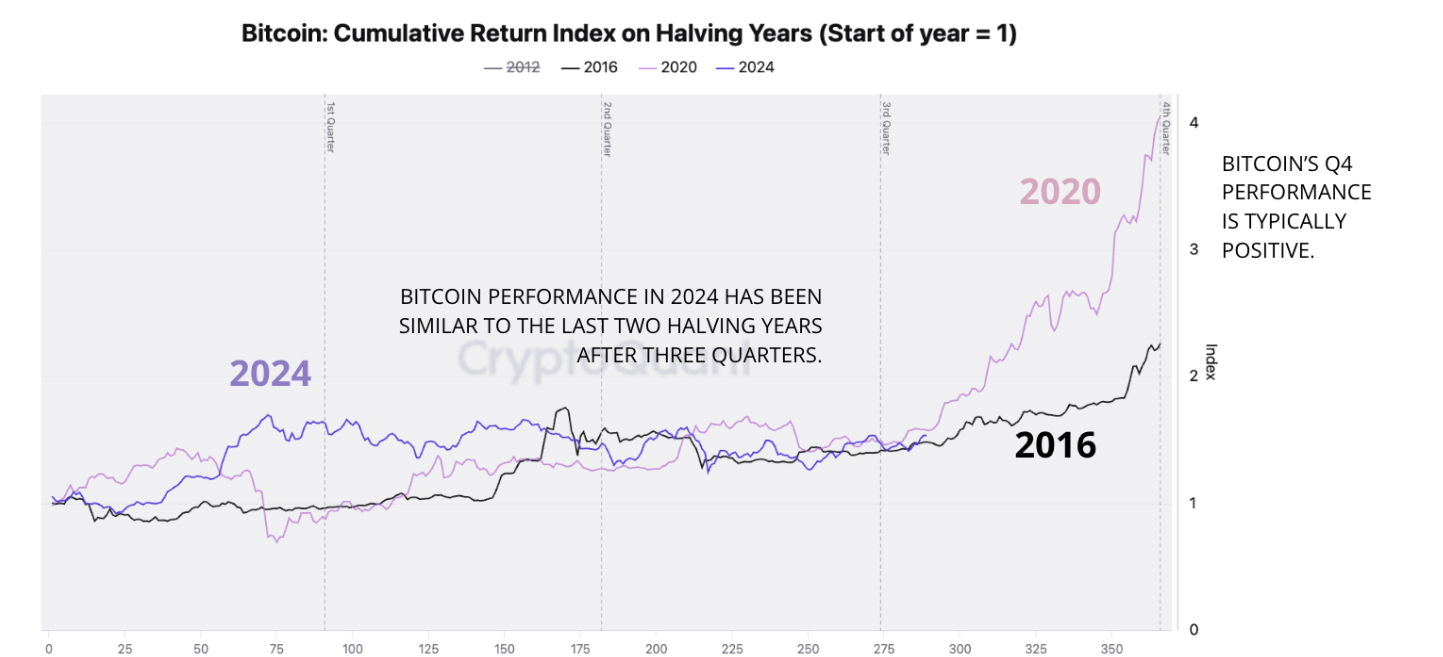
Bitcoin Cumulative Return Index on Halcing Years chart. Source: CryptoQuant
The “Guide to Crypto Markets,” a joint report by Coinbase Institutional and Glassnode published on Wednesday, also explains that BTC’s performance since the fourth halving most closely resembles the performance seen after the third halving, when prices went sideways for several months before moving sharply higher within a year of the event.
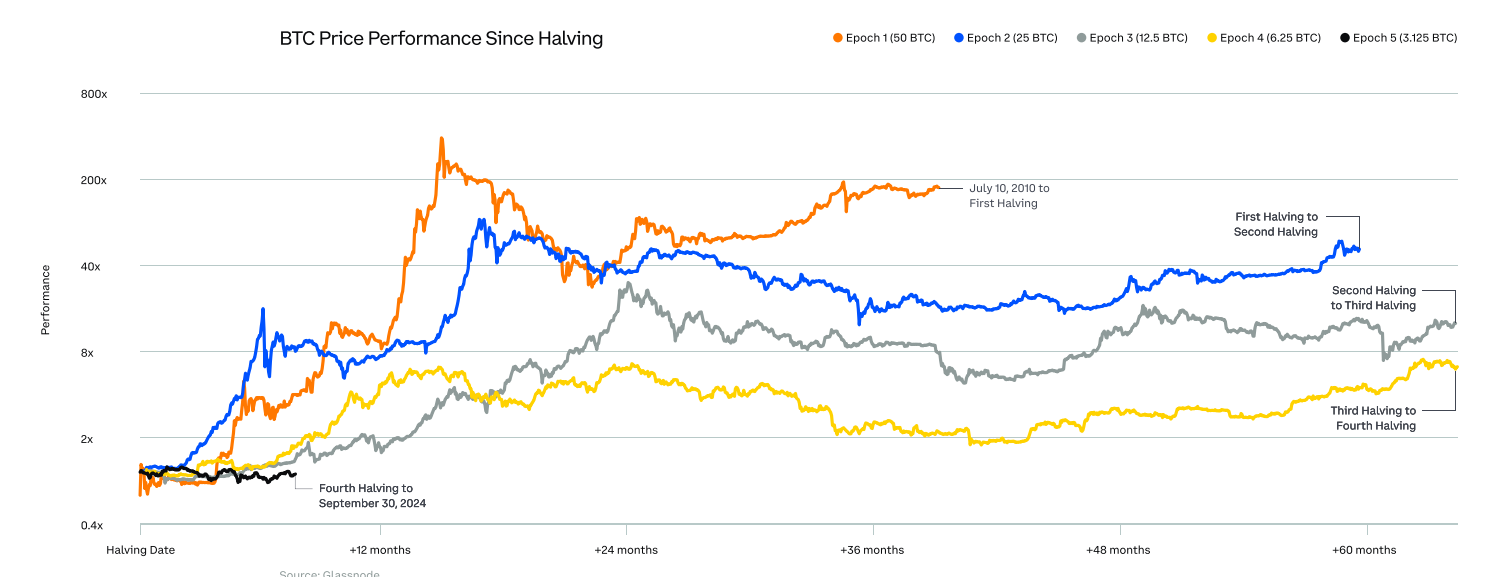
BTC price performance chart. Source: Glassnode
Looking at the US-listed spot Bitcoin ETFs, institutional demand for Bitcoin shows signs of strength this week. According to Coinglass data, the ETFs recorded a third straight day of inflows, totaling $1.38 billion between Monday and Wednesday and $456.90 million of those only on Wednesday. Studying the ETF flow data can be useful for observing institutional investors’ sentiment. If the magnitude of inflows persists or increases, it would signal a rise in demand for Bitcoin, further contributing to its price rally.
-638647517791692706.png)
-638647517994129639.png)
Total Bitcoin Spot ETF Net Inflow chart. Source: Coinglass
Bitcoin Price Forecast: looking at $70,000
Bitcoin price broke above the $66,000 resistance level on Tuesday and rose 2.42% until Wednesday. At the time of writing on Thursday, it trades slightly down around $67,000.
If the $66,000 level holds as support, BTC will continue its ongoing rally to retest its July 29 high of $70,079.
The Moving Average Convergence Divergence (MACD) indicator further supports Bitcoin’s rise after posting a bullish crossover on the daily chart on Monday. The MACD line (blue line) moved above the signal line (yellow line), giving a buy signal. It also shows rising green histogram bars above the neutral line of zero, suggesting increasing upward momentum.
The Relative Strength Index (RSI) in the daily chart is trading at 65, pointing downwards, reflecting the decrease in the bullish momentum. If it continues to decline towards the neutral level of 50, it will be a sign of a deeper correction.
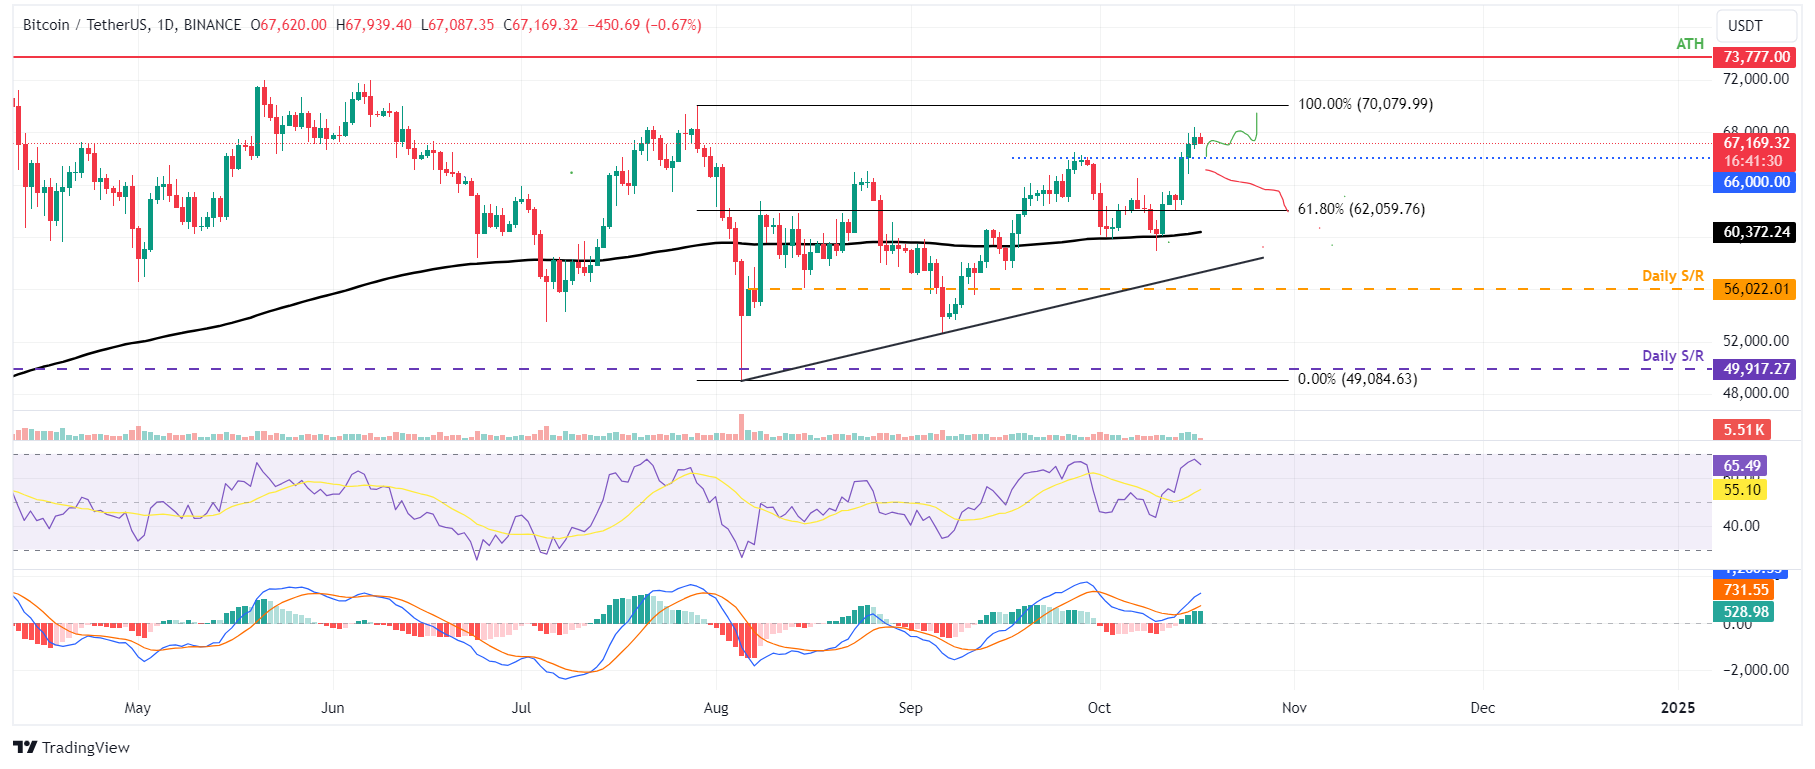
BTC/USDT daily chart
If BTC fails to find support around the $66,000 level and closes below it, Bitcoin could extend the decline by 6% and retest its $62,000 support level, which aligns with the 61.8% Fibonacci retracement level at $62,059 (drawn from July high of $70,079 to August low of $49,084).
Bitcoin, altcoins, stablecoins FAQs
Bitcoin is the largest cryptocurrency by market capitalization, a virtual currency designed to serve as money. This form of payment cannot be controlled by any one person, group, or entity, which eliminates the need for third-party participation during financial transactions.
Altcoins are any cryptocurrency apart from Bitcoin, but some also regard Ethereum as a non-altcoin because it is from these two cryptocurrencies that forking happens. If this is true, then Litecoin is the first altcoin, forked from the Bitcoin protocol and, therefore, an “improved” version of it.
Stablecoins are cryptocurrencies designed to have a stable price, with their value backed by a reserve of the asset it represents. To achieve this, the value of any one stablecoin is pegged to a commodity or financial instrument, such as the US Dollar (USD), with its supply regulated by an algorithm or demand. The main goal of stablecoins is to provide an on/off-ramp for investors willing to trade and invest in cryptocurrencies. Stablecoins also allow investors to store value since cryptocurrencies, in general, are subject to volatility.
Bitcoin dominance is the ratio of Bitcoin's market capitalization to the total market capitalization of all cryptocurrencies combined. It provides a clear picture of Bitcoin’s interest among investors. A high BTC dominance typically happens before and during a bull run, in which investors resort to investing in relatively stable and high market capitalization cryptocurrency like Bitcoin. A drop in BTC dominance usually means that investors are moving their capital and/or profits to altcoins in a quest for higher returns, which usually triggers an explosion of altcoin rallies.
Author

Manish Chhetri
FXStreet
Manish Chhetri is a crypto specialist with over four years of experience in the cryptocurrency industry.


