Bitcoin Price Analysis: BTC could be poised for another $10,000 retest
- BTC is slowing down significantly after its initial rebound from $10,000.
- Several exchanges have released reports in favor of a bearish outlook and a retest of the critical $10,000 support level.

Bitcoin is currently trading at $10,700 after a failed attempt to climb above $11,000. The digital asset has established a robust support level at $10,000, defended on several occasions throughout September.
One of the leading cryptocurrency exchanges, OKCoin, has released a report stating that 'traders lean bearish on BTC.' According to the report, several on-chain metrics are showing a bearish outlook for the flagship cryptocurrency. It seems that the number of active users and transactions has remained flat during September.
This is a bearish factor that negatively impacts the growth of the Bitcoin network, explains OKCoin. The report also mentions the upcoming U.S. presidential election, stating:
The performance of most markets has historically been mixed around the time of previous U.S. elections, bitcoin included
BTCC, one of the oldest cryptocurrency exchanges, seems to agree. They also released a report stating that Bitcoin is losing momentum in the short-term. Let's look at some technical indicators and other on-chain metrics to determine the most likely scenarios.
BTC/USD daily chart
-637370674288541374.png)
The most important factor on the daily chart is the $10,000 support level. Throughout 2020 and some part of 2019, the $10,000 level acted as the most critical resistance level until it was finally broken for good on July 27. More often than not, intense resistance levels turn into strong support levels, which we see now.
Bitcoin is currently trading at $10,700 right between the 50-MA, acting as a resistance point, and the 100-MA, which is support.
BTC/USD 4-hour chart
-637370674418853596.png)
On the 4-hour chart, Bitcoin's price has established a lower high, and bears are close to confirming a downtrend. The MACD has turned bearish already, but the 50-MA continues acting as a support level. The 100-MA also turned into support on September 28 but was lost recently, and bulls are trying to recover it.
Not everything is against Bitcoin
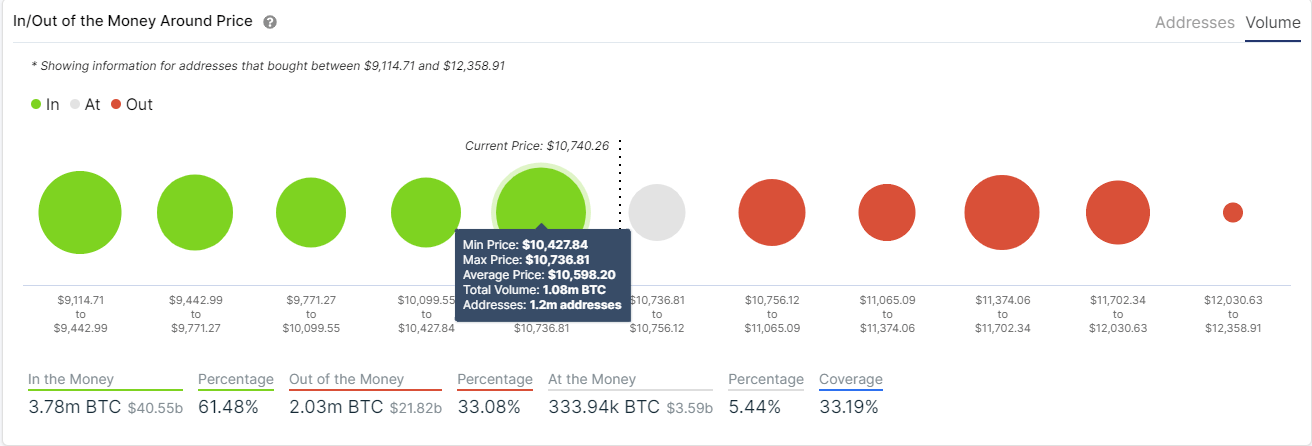
On the other hand, several other metrics are actually in favor of the bulls. The In/Out of the Money Around Price chart by IntoTheBlock shows stronger support than resistance. Between $10,427 and $10,736, more than one million addresses bought 1,000,000 Bitcoin. Furthermore, below this support area, the IOMAP chart indicates that support is strong well until $9,000.
BTC IOMAP Chart
Another interesting point was raised by Willy Woo, a famous on-chain analyst. Woo states that the spike in activity by new participants is not yet reflected in the price, something that doesn't happen often.
#marketupdate
— Willy Woo (@woonomic) September 30, 2020
We're seeing a spike in activity by new participants coming into BTC not yet reflected in price, it doesn't happen often. This is what traders call a divergence, in this case it's obviously bullish.
Chart by @glassnode pic.twitter.com/WrQueYL9up
According to Woo, this is a clear bullish sign and a divergence. Eric Thies pointed out another interesting fact on Twitter about Bitcoin's price action after its halving. Bitcoin halvings happen roughly every four years and they aim to reduce mining rewards in half. The last halving event in 2016 was followed by a 20% price increase over the next 123 days. Similar price action seems to be taking place now, after another 123 days from the last halving.
123 Days after the #BTC halving event in 2016, the 1M opening price had increased 20%.
— Eric Thies (@KingThies) September 30, 2020
123 days after the #BTC halving event in 2020, the 1M opening price had also increased 20%. pic.twitter.com/5c2XF0SXKx
This seems to indicate that if history repeats itself, we could see Bitcoin enter another massive bull rally and probably surpass its last all-time high.
Nonetheless, $11,000 remains the most crucial resistance level in the short-term. A breakout above this point would allow Bitcoin to retest $12,000. The $10,500 support level where the 100-MA is established on the daily chart is the most important on the bearish side. It also coincides with the most substantial support area in the IOMAP chart. A bearish breakout will push Bitcoin down to $10,000
Author

Lorenzo Stroe
Independent Analyst
Lorenzo is an experienced Technical Analyst and Content Writer who has been working in the cryptocurrency industry since 2012. He also has a passion for trading.


