Bitcoin Price Forecast: BTC pursues $33,600 before retracing further
- Bitcoin price has been locked in a descending triangle pattern, indicating a bearish outlook.
- The leading cryptocurrency could see a potential trend reversal toward $33,600.
- A technical indicator flashed a buy signal, adding credence to the recovery thesis.

Bitcoin price could see its downtrend retreat as it appears to reverse a period of underperformance. However, a potential rally would not be long-lived, as the prevailing chart pattern could ruin the bullish outlook.
Bitcoin price expects a short-term reversal
Bitcoin price has been forming lower highs and lower lows since June 29. On the daily chart, BTC appears to be trading within a descending triangle pattern despite a bull trap that emerged on June 14, which quickly retreated by June 18.
Despite the current bearish chart pattern, Bitcoin price could be expecting a short-term reversal. The Momentum Reversal Indicator (MRI) has flashed a buy signal on July 16 while recording a new monthly low at $31,000.
Bitcoin price would need to secure a daily close above the 27.2% Fibonacci extension level at $32,191 for the bullish forecast to materialize. Should this level be achieved, BTC could tag the 38.2% Fibonacci extension level, coinciding with the 20-day Simple Moving Average (SMA) at $33,574.
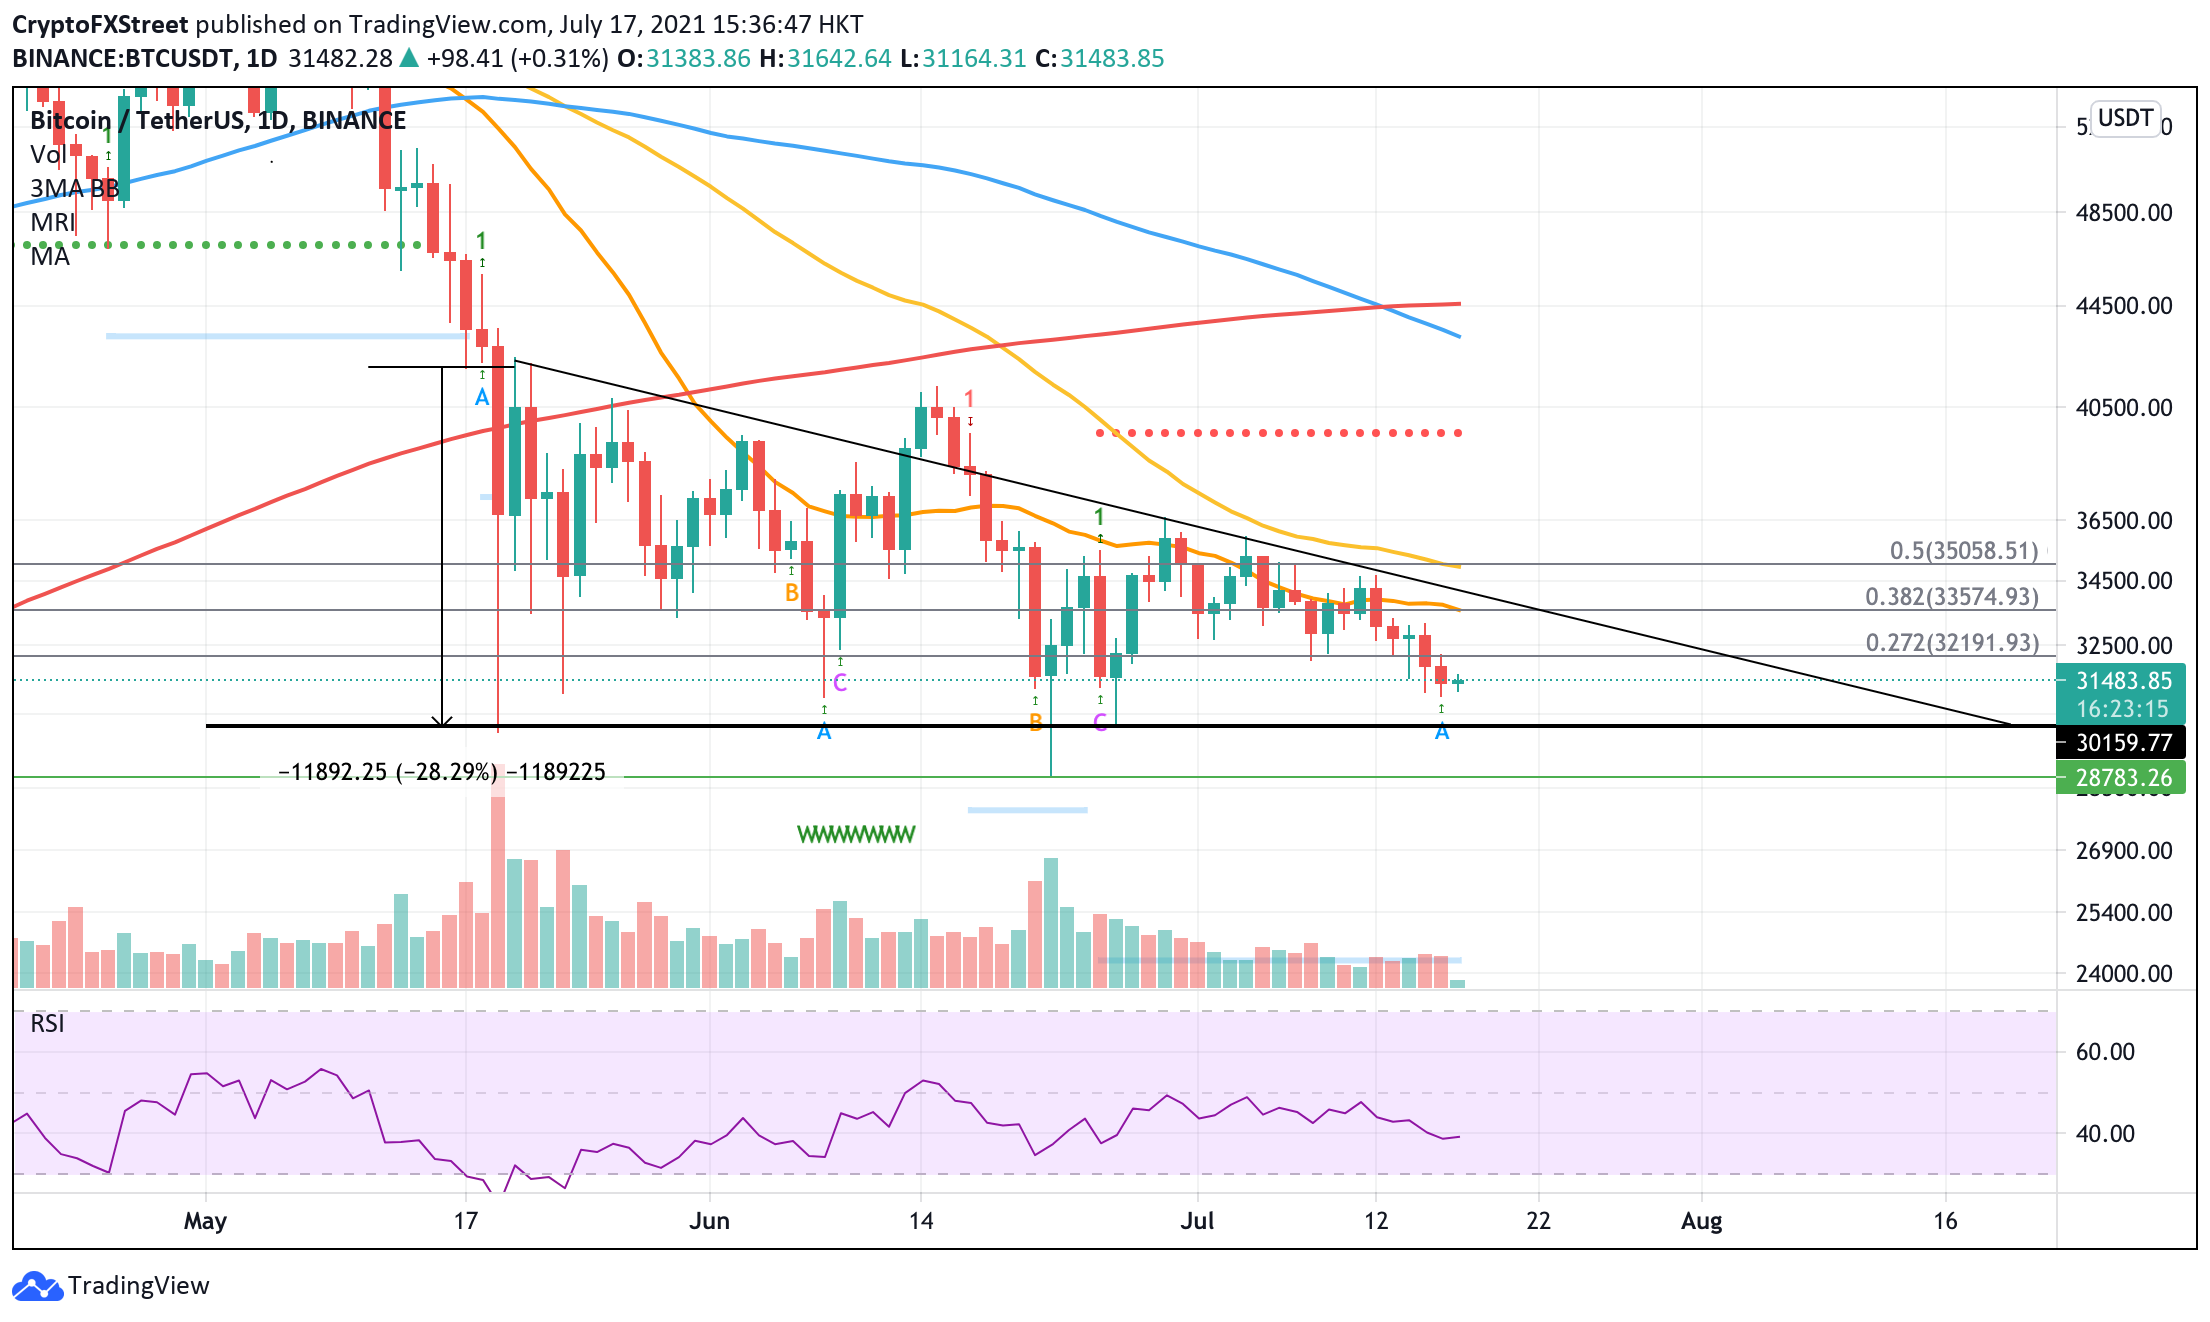
BTC/USDT daily chart
Further buying pressure could see Bitcoin price slice above the hypotenuse of the descending triangle pattern and target the 50% Fibonacci extension level, corresponding to the 50-day SMA at $35,000.
Investors should note that the chart pattern has a primarily bearish bias. Therefore, speculators should note that Bitcoin price could look to retest critical levels of support before a bullish breakout occurs.
Outstanding support could be found at $30,159, the lower boundary of the descending triangle pattern. Further bearish momentum could push Bitcoin price down to retest the June low at $28,782.
Only if Bitcoin price were to lose the support level mentioned above would put the bearish target of the chart pattern on the radar, a 28% decline which sits at $21,542.
Author

Sarah Tran
Independent Analyst
Sarah has closely followed the growth of blockchain technology and its adoption since 2016.


