Bitcoin price action looks very similar to 2016: small correction ahead before a face-melting rally
- Bitcoin price tried to break the all-time high but couldn’t manage to do it on all exchanges just yet.
- The current price action looks very similar to previous Bitcoin rallies.

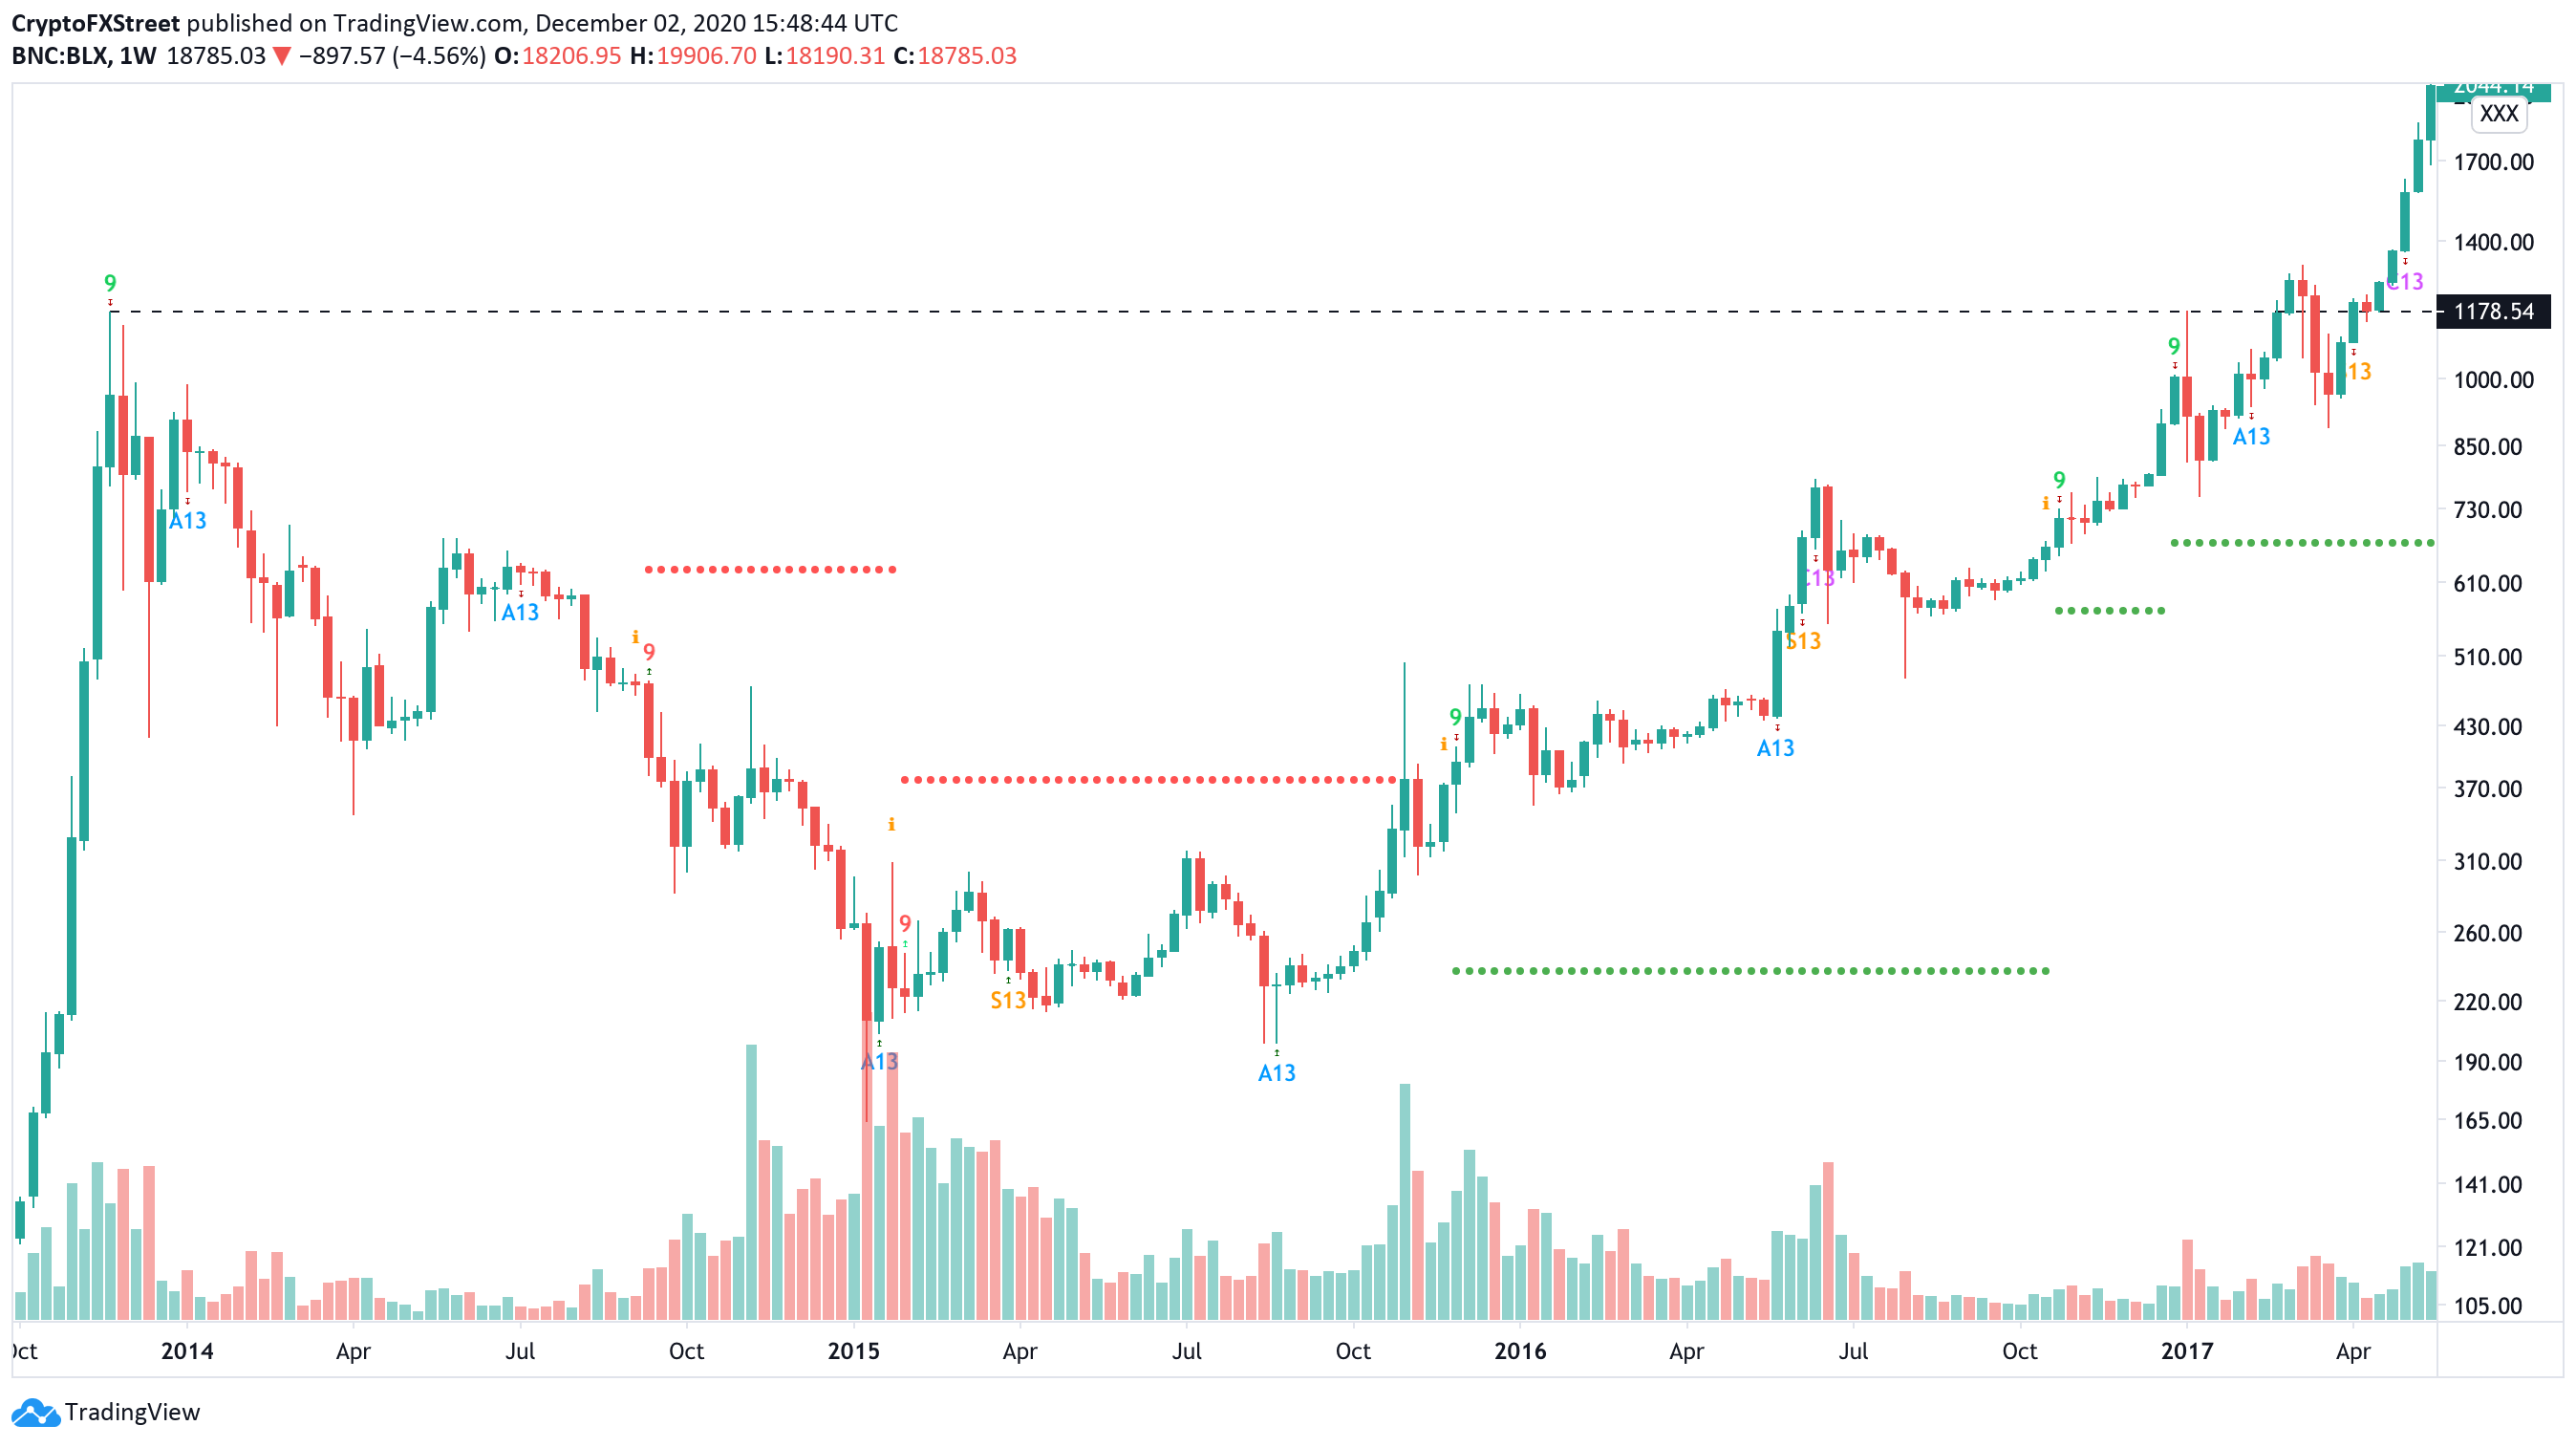
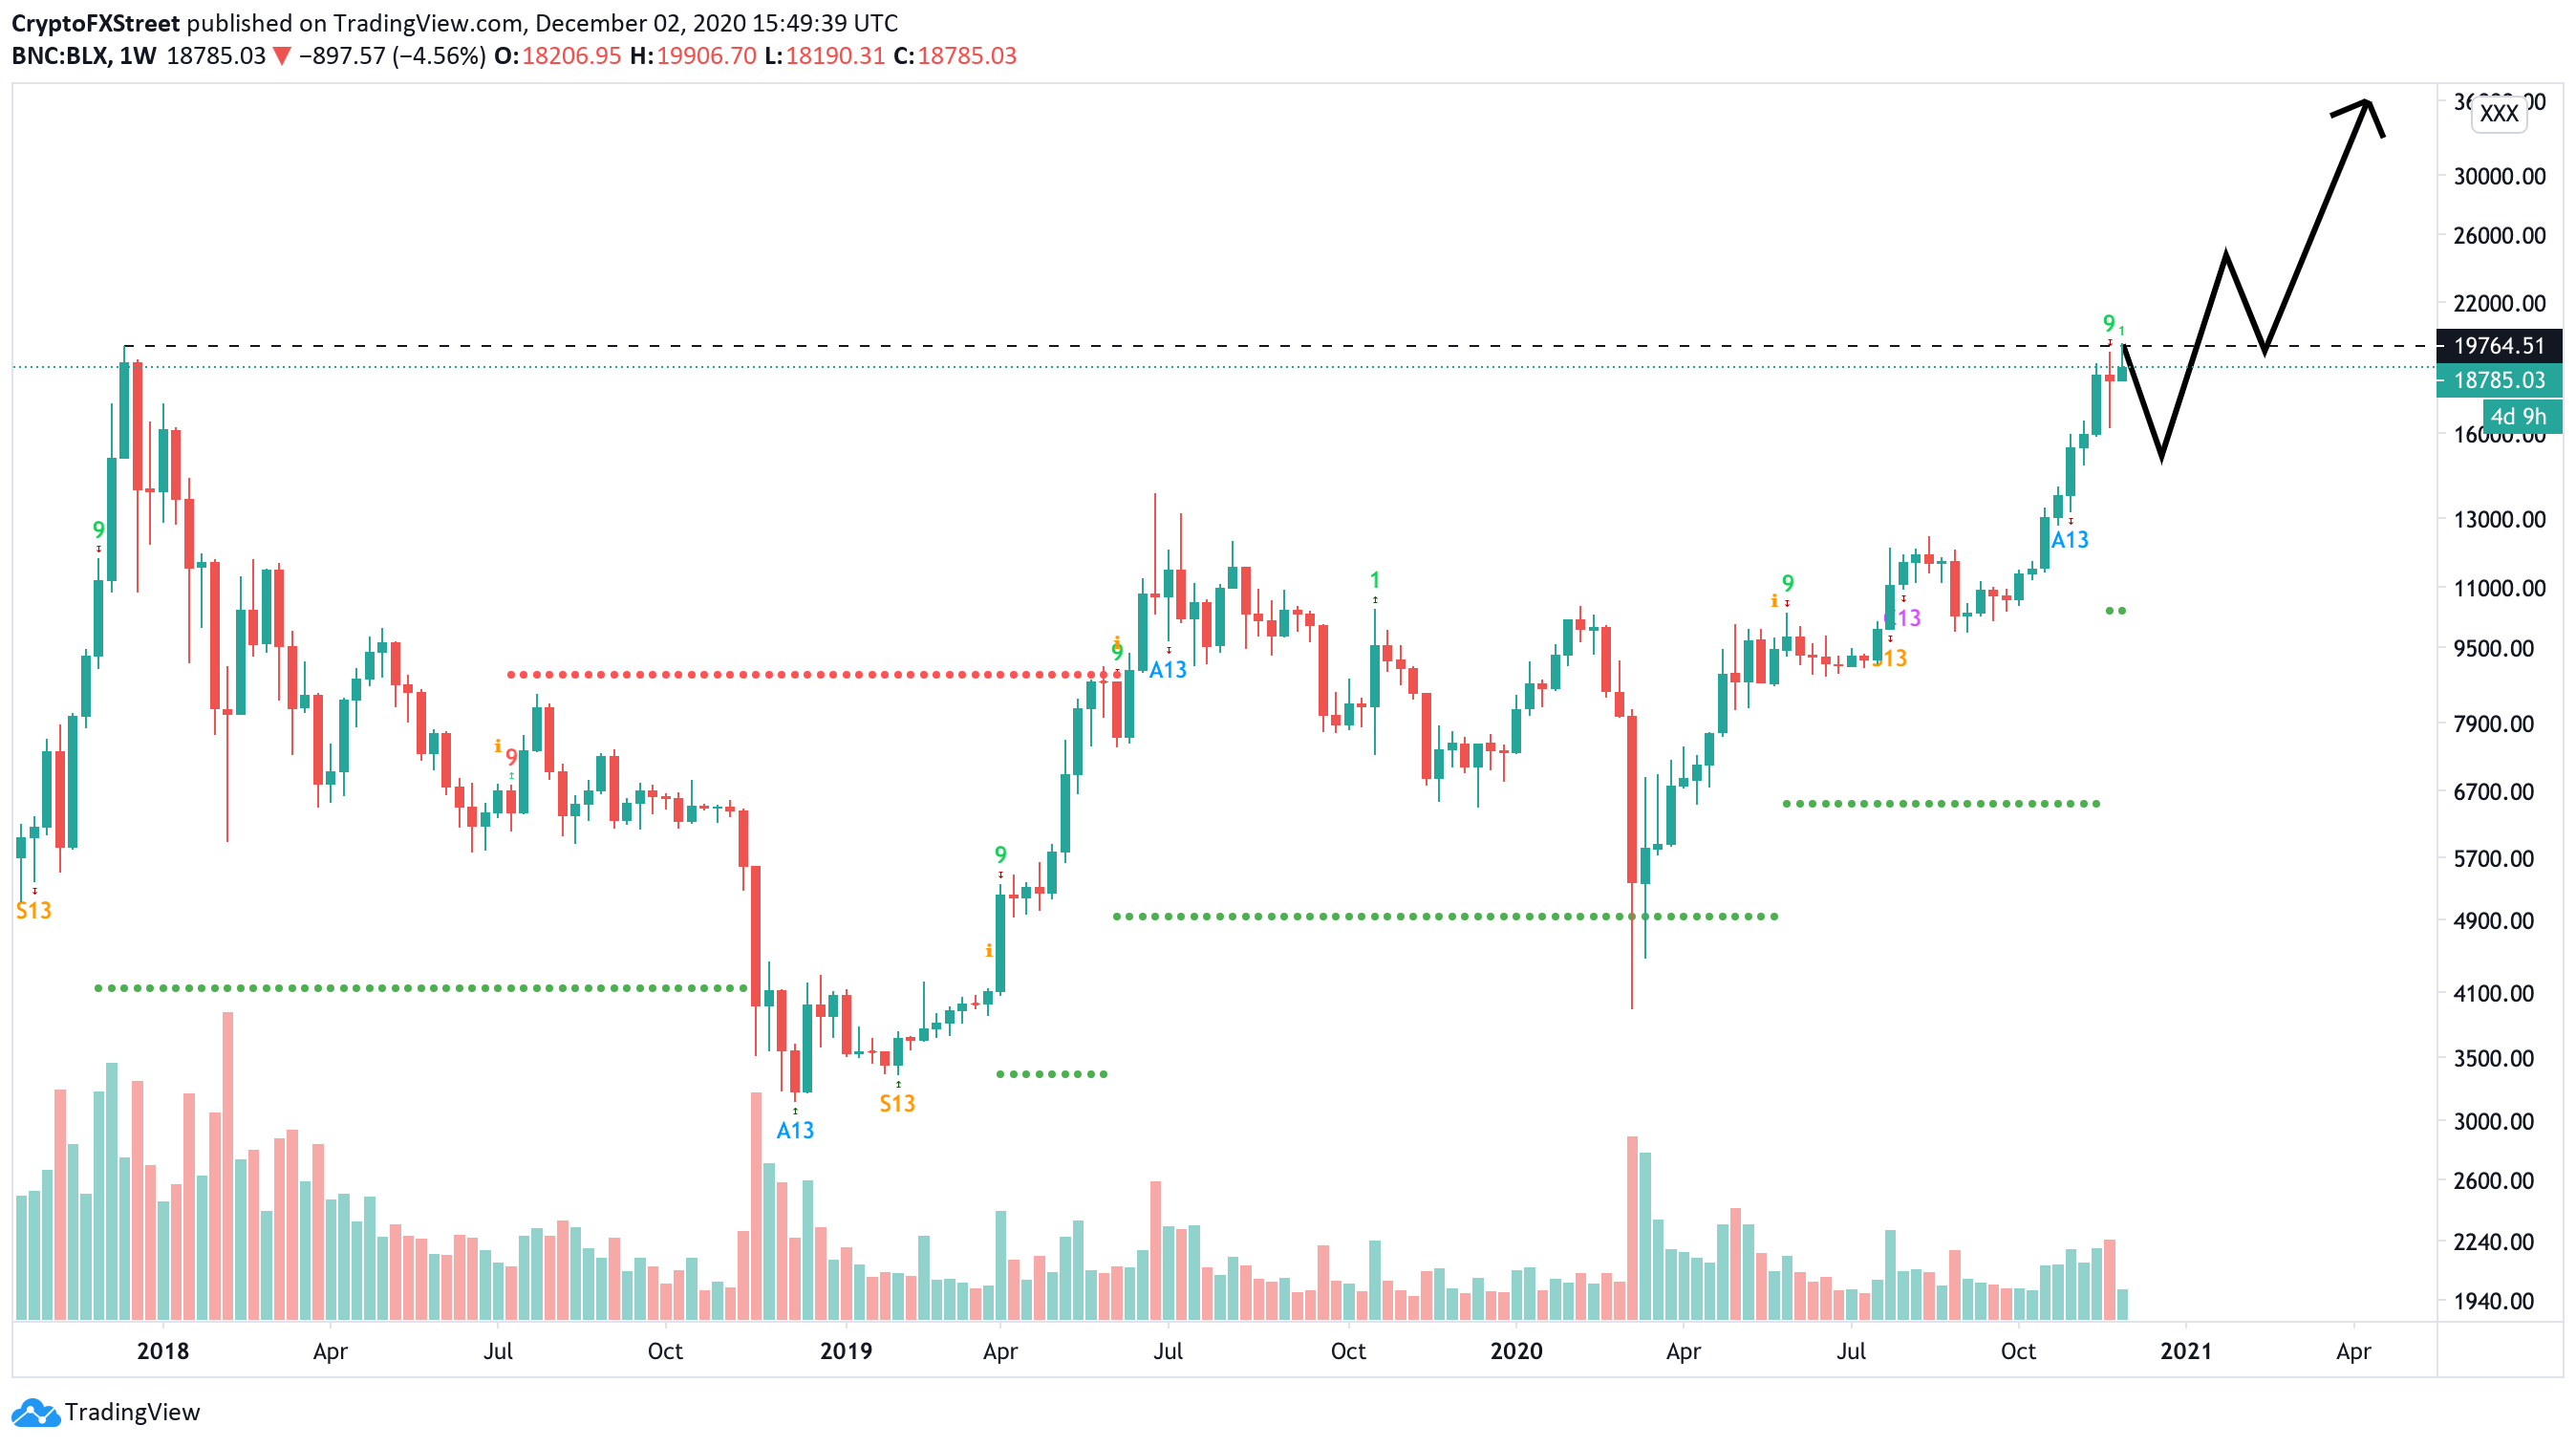
On December 1, Bitcoin attempted to crack the previous all-time high but only managed to do so on a few exchanges. The current price action resembles what happened back in 2017 when Bitcoin tried to crack the all-time high at the time at $1,177 and briefly managed to climb above it just to fall within the next few days.
Is Bitcoin on the verge of another insane rally?
Back on November 25, 2013, Bitcoin established a high of $1,177, which made the digital asset quite popular among social media and news outlets. Bitcoin had a two-year consolidation period until November 2015.
BTC/USD weekly chart
On January 2, 2017, Bitcoin price attempted to crack the all-time high of $1,177 and managed to do so, climbing to $1,180 but ultimately getting rejected, dropping 36%. Additionally, it seems that both times the TD Sequential indicator presented sell signals.
BTC/USD weekly chart
The current price action is definitely similar as Bitcoin did crack the last all-time high by a couple of dollars on some exchanges and retraced shortly after. The TD Sequential indicator also presented a sell signal, which means Bitcoin price might need to retrace even further before the final push.
This All Time High breakout is very similar to 2016.
— Charles Edwards (@caprioleio) December 2, 2020
Both times were trending with total Production Cost.
Both times tested the ATH, then re-visited the Production cost.
The fact that Production Cost is so near ATH, is very bullish.
It means downside is limited. pic.twitter.com/06zeiiJ3ni
Charles Edwards, founder of Capriole Investments, notes over Twitter that Bitcoin’s trend with Total Production Cost is also very similar to 2016. This metric basically uses Bitcoin’s electricity consumption as a reference. Currently, this metric is really close to the current price, which indicates the downside is limited.
Bitcoin MVRV chart
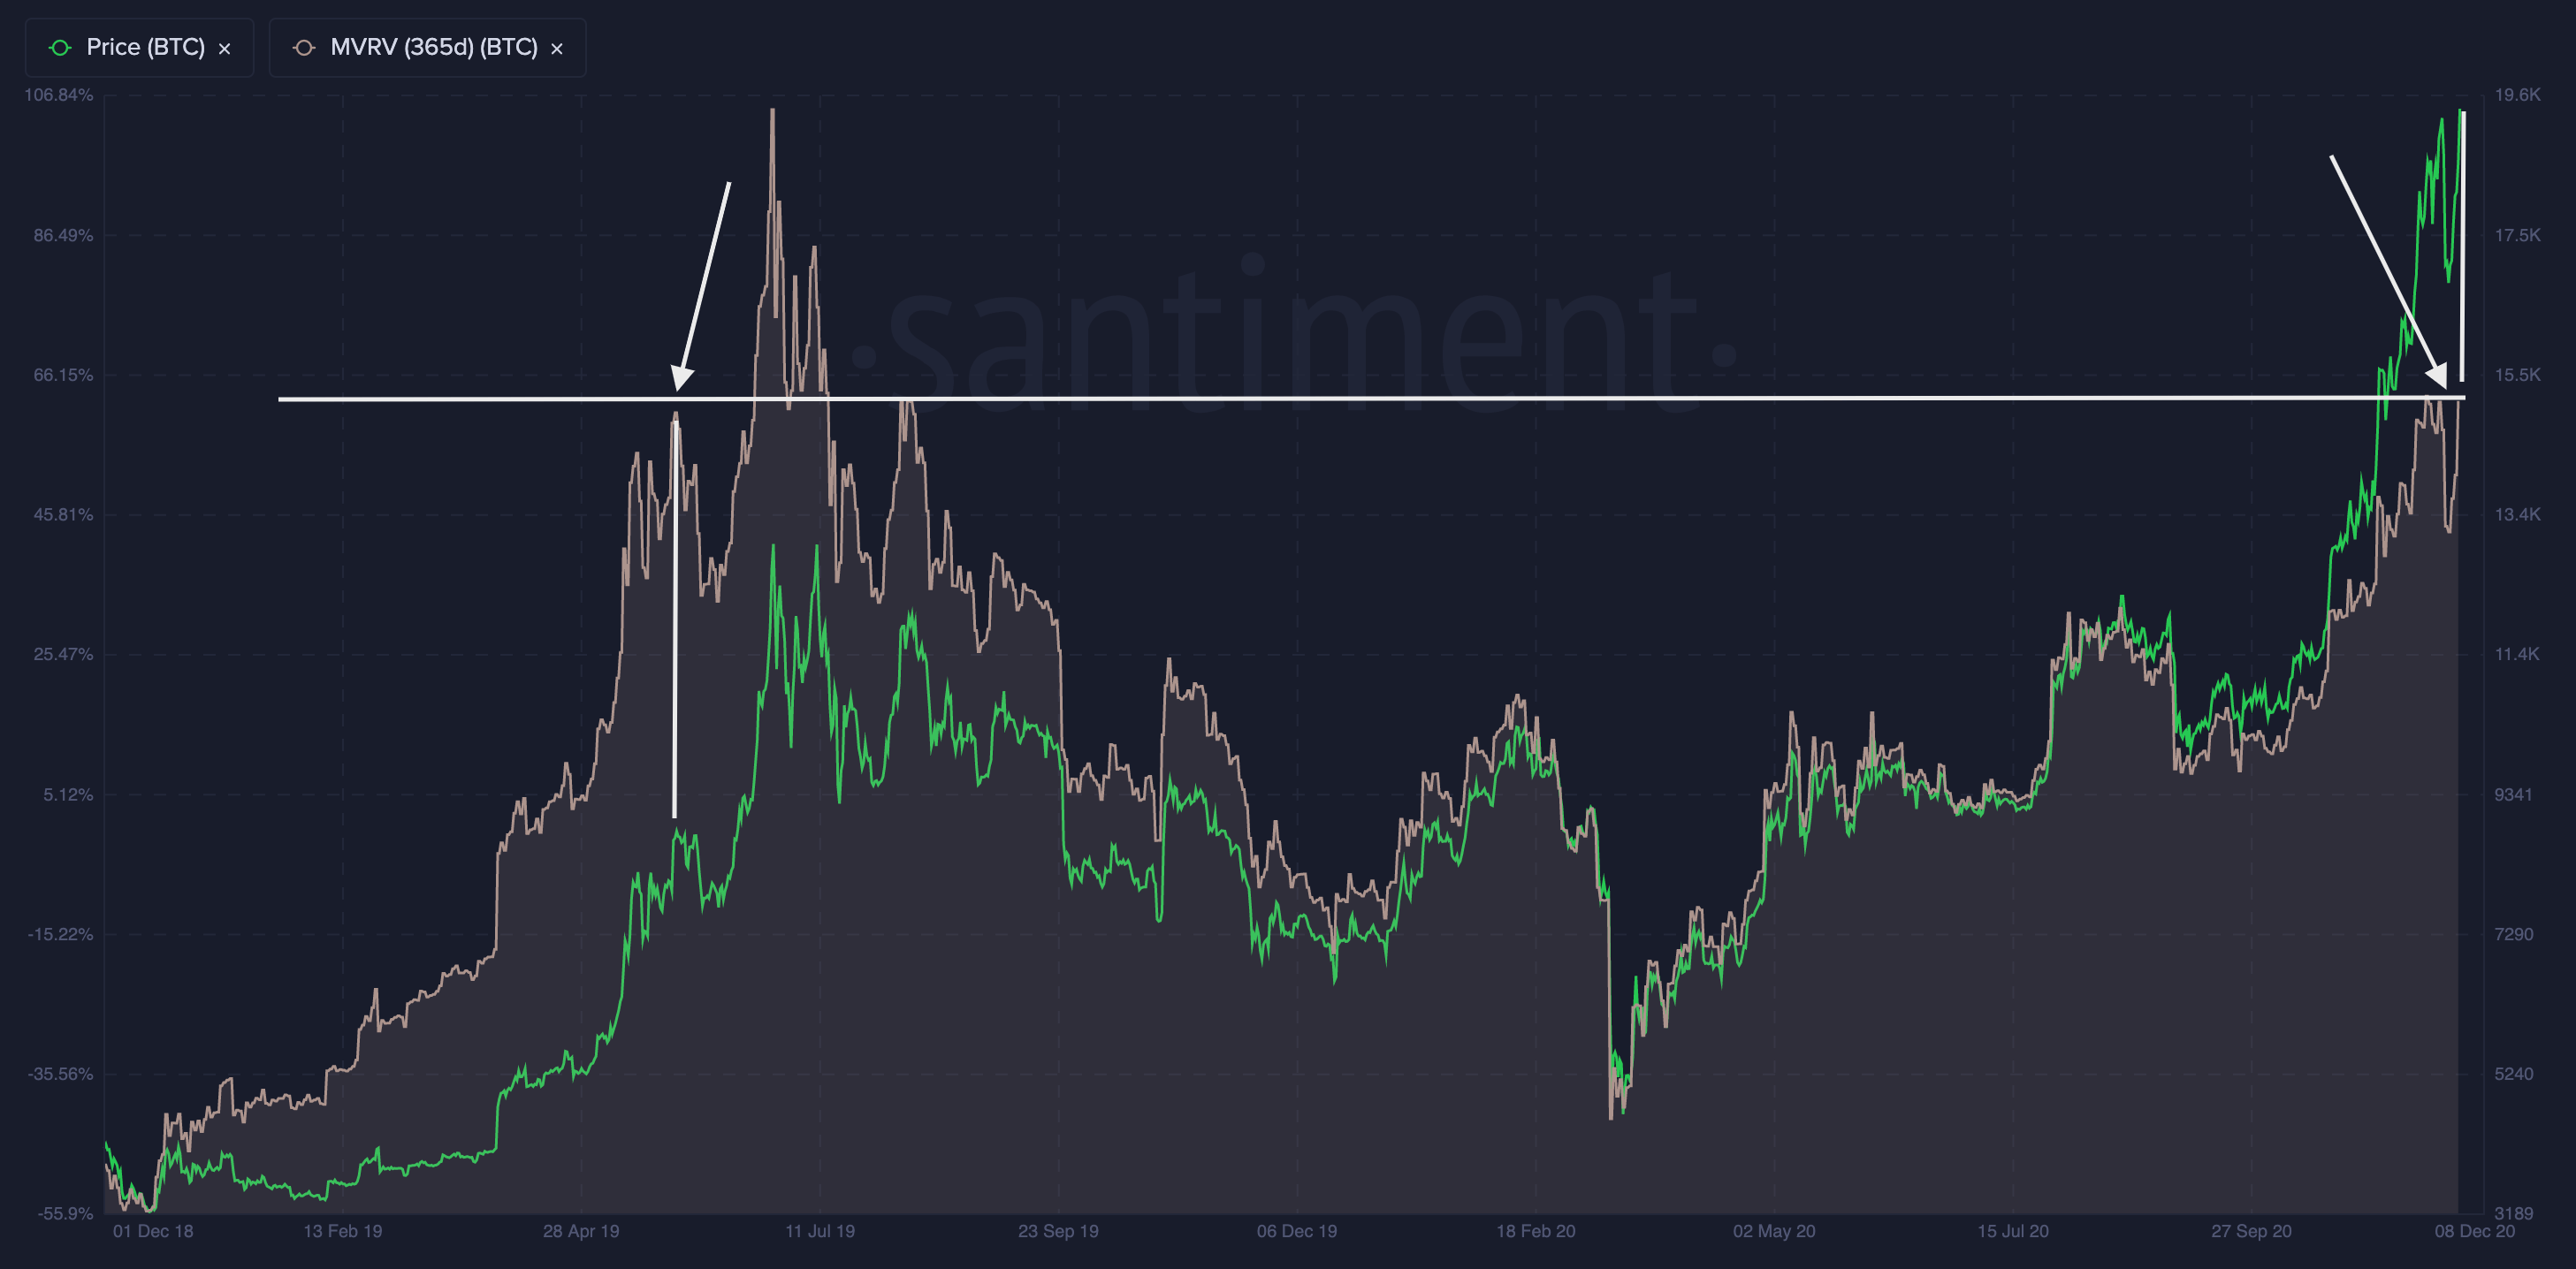
On top of that, social sentiment has increased significantly over the past months, usually indicative of potential pullbacks. The MVRV chart is also remarkably similar to what happened during the top of the 2019 bull run. Bitcoin has just hit 65%, which was followed by a correction last time and then a final breakout. Considering all of these metrics, it certainly seems that the flagship cryptocurrency is ready for a breakout above the all-time high but might need to consolidate first.
Author

Lorenzo Stroe
Independent Analyst
Lorenzo is an experienced Technical Analyst and Content Writer who has been working in the cryptocurrency industry since 2012. He also has a passion for trading.



