Bitcoin failure to break top indicates ABCDE triangle

Bitcoin (BTC/USD) has not been able to break the previous top for almost 5 weeks now. A bearish retracement is starting to get the upper hand. How deep can the pullback decline before finding key support?
Price Charts and Technical Analysis
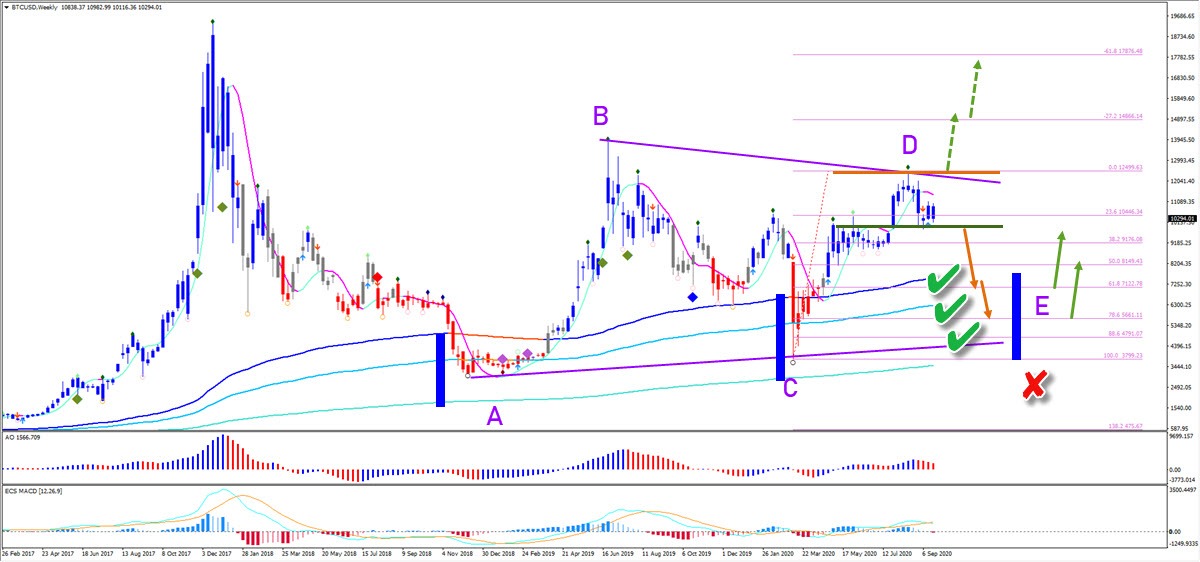
Momentum usually runs out of steam when 5 to 6 candles fail to break the high. So if price action is unable to break the top by the end of the next trading week (by 2-4 October), then a bearish retracement is likely. In that case, an ABCDE triangle pattern (purple) is the dominant outlook for Bitcoin. The last swing is then a wave E (purple), which could last several months before it’s completed.
The wave E will probably find support at the Fibonacci retracement levels. The key support zones are the 61.8% and 78.6% Fibonacci levels. Although wave Es in general are known for the fact that they stop at any spot. This also is aided by the long-term moving averages, which have acted as support before (blue boxes). A break below the 100% Fib invalidates (red x) the triangle pattern. A break below the local support (green box) confirms the downside (orange arrows) whereas an unexpected break above local resistance (orange box) could kick start an immediate breakout (dotted green arrows).
The daily chart saw price action behaving in a classical way. First a bounce at the 144 ema and then a respect for the 21 ema zone as resistance. Unless price action breaks above the top, the bears have the best odds at the moment to push price below the support (green box) and towards the Fibonacci support zones.
-637365276689253591.jpg)
The analysis has been done with the ecs.SWAT method and ebook.
Author

Chris Svorcik
Elite CurrenSea
Experience Chris Svorcik has co-founded Elite CurrenSea in 2014 together with Nenad Kerkez, aka Tarantula FX. Chris is a technical analyst, wave analyst, trader, writer, educator, webinar speaker, and seminar speaker of the financial markets.


