Bitcoin Cash Price Prediction: BCH aims for $300 if this resistance zone breaks – Confluence Detector
- BCH faces a strong resistance zone around the $245-level.
- BCH had a bullish breakout following a price consolidation period.

BCH has managed to pack together four consecutive bullish sessions in the 12-hour price chart. The price was going through a consolidation period prior to the breakout, as seen by the squeezing of the Bollinger band.
BCH/USD daily chart
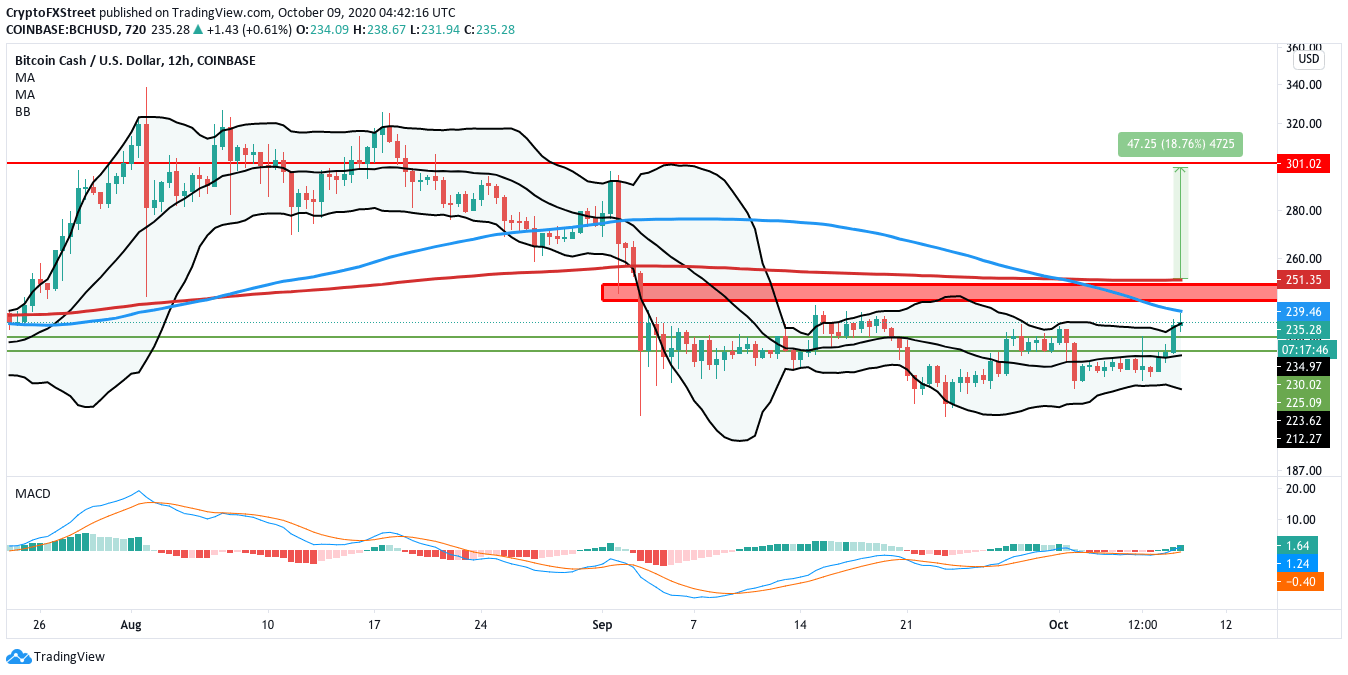
Currently, the price has broken above the upper curve of the Bollinger band is facing rejection at the 100-12-hour SMA curve. The MACD shows increasing bullish momentum, which should give the bulls enough force to move above this curve. However, BCH will then immediately face a resistance zone between 100-12-hour and 200-12-hour SMA curves, as seen in the confluence detector.
BCH confluence detector
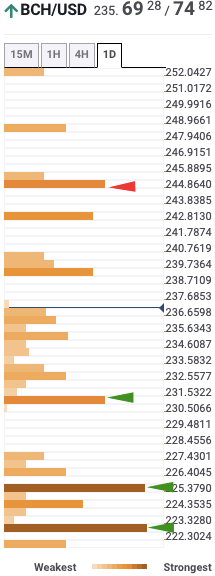
The confluence detector is a useful tool that helps us visualize strong resistance and support levels. As per the detector, there is a strong resistance between $244-$245, which coincides with the zone between the 100-12-hour and 200-12-hour SMA curves. If the price breaks above this zone, the BCH bulls have a clear path till $300, before it meets another strong resistance level.
What if the bears take over following repeated rejections?
On the flip side, if the price gets rejected at this zone, the price may drop down to the $230 support level, as marked by the daily confluence detector. Further rejection will drop the price down to the $225 support level, which looks strong enough to absorb a tremendous amount of selling pressure. Following that, we have another healthy support at $223.
Another factor that adds further credence to the bearish thesis is IntoTheBlock’s “New Addresses” chart.
BCH new addresses
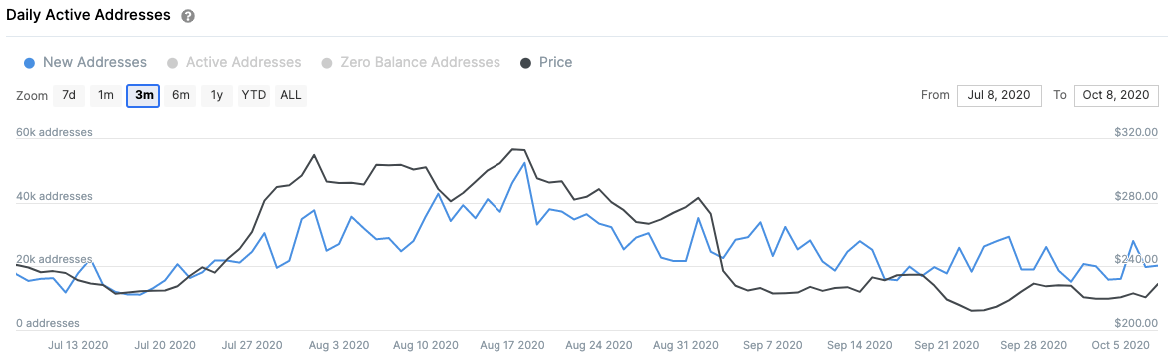
As per the chart, the new addresses entering the BCH ecosystem rose from 11,800 to 52,500 from July 12 to August 18. Following that, the number of addresses has been steadily decreasing. As of press time, only 20,300 new addresses were created in the network. There is a direct correlation between the new addresses entering and price action. Fewer new addresses joining the network usually equates to decreasing prices.
Verdict: Following a bullish breakout from the Bollinger band, BCH faces a stiff resistance zone around $245 bordered by the 100-12-hour and 200-12-hour SMA curves. If BCH successfully breaks above this, they should take the price up to the $300-level. On the flip side, rejection will drop BCH down to the $230 support level. Further breakdown may drop BCH to the $225 support level.
Author

Rajarshi Mitra
Independent Analyst
Rajarshi entered the blockchain space in 2016. He is a blockchain researcher who has worked for Blockgeeks and has done research work for several ICOs. He gets regularly invited to give talks on the blockchain technology and cryptocurrencies.


