Share:
  • The parabolic SAR has reversed from bullish to bearish in the 4-hour chart.
  • The IOMAP shows that the price is currently sitting on top of a healthy support wall.

The BCH 4-hour chart flashed a sell sign in the TD sequential indicator. After flashing the signal, the price has been trending horizontally over the next six sessions.

bchusd 4-hour chart

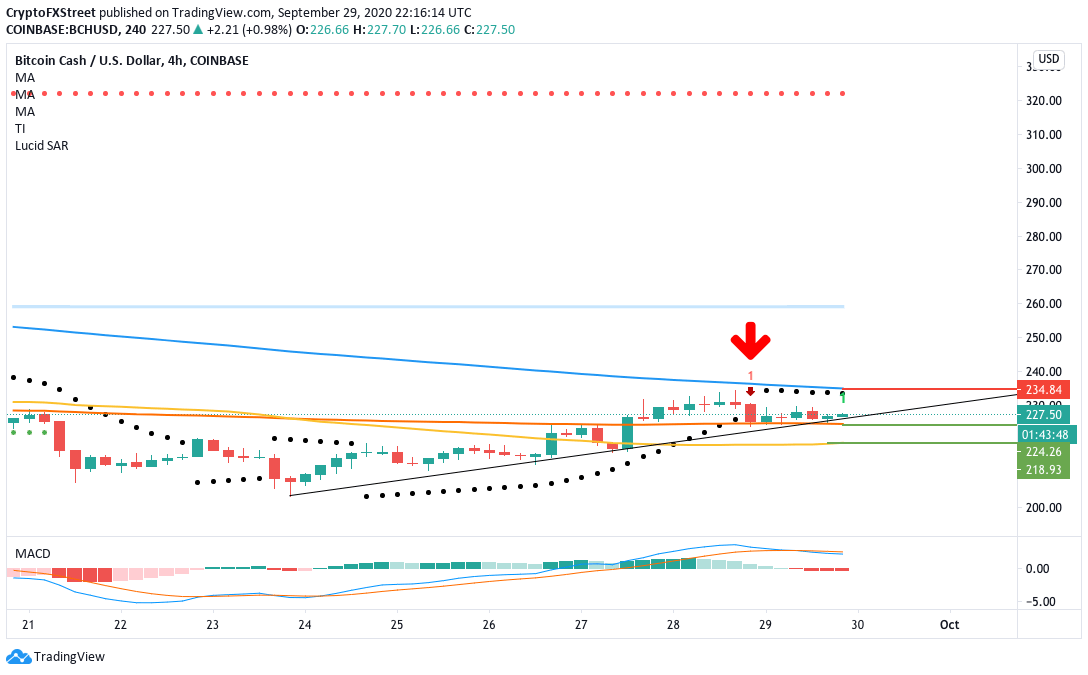
BCH needs to break below the upward trending line and the SMA 200 ($224.25) to validate that sell signal and strengthen the downtrend. The parabolic SAR and MACD are both bearish, which shows that the price should ideally break below this period of consolidation. However, why is the price consolidating in the first place instead of going down? For that, we need to look at the IOMAP.

BCH IOMAP 

fxsoriginal

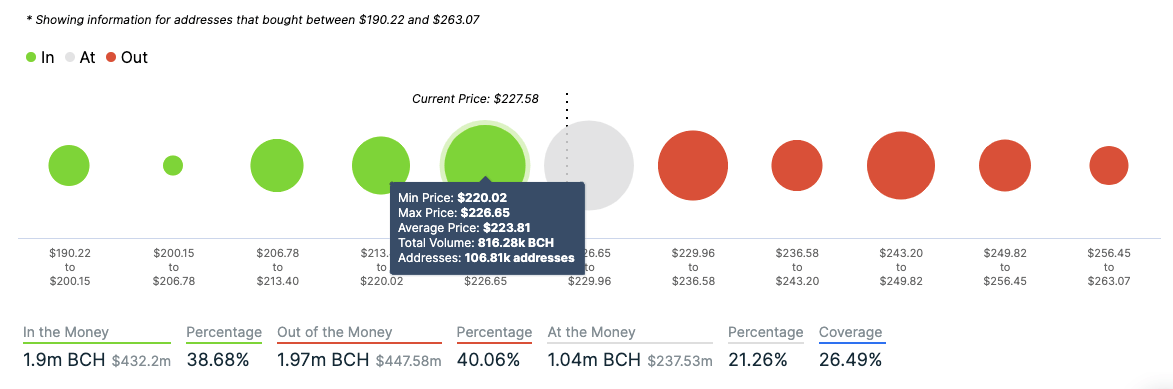
IntoTheBlock’s “In/Out of the Money Around Price” model (IOMAP) shows us that BTC is presently sitting on top of a strong support wall at $223. At this level, around 106,810 addresses had previously purchased 816,280 BCH. As per the IOMAP, this support wall absorbs a lot of the selling pressure, which is preventing the downward trend, for now. However, if the sellers do break below this level, they may have enough momentum to take the price below $200.

On the upside, we have a moderate-to-strong resistance level, $233. In this level, 96,400 addresses had bought 594,000 BCH. 

BCH 12-hour chart

bchusd 12-hour chart

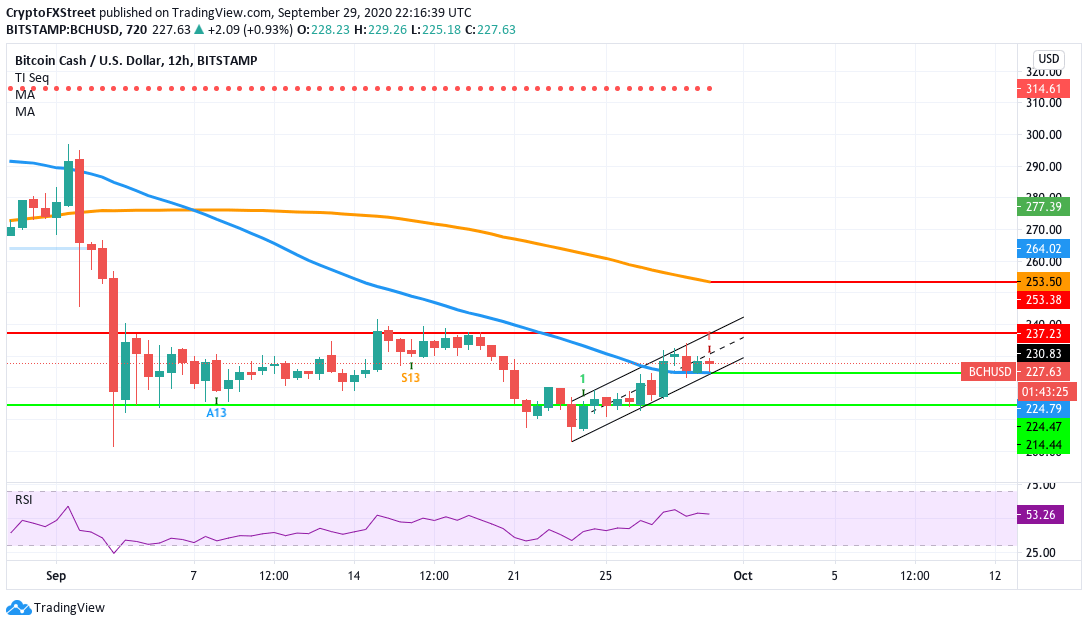
The 12-hour chart helps us gain a better understanding of the potential price action. The latest candlestick has also flashed a sell signal in the TD sequential indicator. To solidify this downtrend, the price must break below the SMA 50 ($224) to have a bearish breakout from the flag formation. Following this, the price will probably drop down to the $214.45 support level. The relative strength index (RSI) is trending around the neutral zone, which shows that the sellers have plenty of room to move before the asset becomes undervalued. 

BCH Key levels

BCH/USD

Overview
Today last price 227.7138
Today Daily Change 1.9304
Today Daily Change % 0.85
Today daily open 225.7834
 
Trends
Daily SMA20 224.9054
Daily SMA50 254.8247
Daily SMA100 252.1534
Daily SMA200 242.794
 
Levels
Previous Daily High 234.6996
Previous Daily Low 223.8736
Previous Weekly High 233.4679
Previous Weekly Low 203.1995
Previous Monthly High 338.2532
Previous Monthly Low 244.1306
Daily Fibonacci 38.2% 228.0091
Daily Fibonacci 61.8% 230.564
Daily Pivot Point S1 221.5381
Daily Pivot Point S2 217.2929
Daily Pivot Point S3 210.7121
Daily Pivot Point R1 232.3641
Daily Pivot Point R2 238.9449
Daily Pivot Point R3 243.1901


Note: All information on this page is subject to change. The use of this website constitutes acceptance of our user agreement. Please read our privacy policy and legal disclaimer. Opinions expressed at FXstreet.com are those of the individual authors and do not necessarily represent the opinion of FXstreet.com or its management. Risk Disclosure: Trading foreign exchange on margin carries a high level of risk, and may not be suitable for all investors. The high degree of leverage can work against you as well as for you. Before deciding to invest in foreign exchange you should carefully consider your investment objectives, level of experience, and risk appetite. The possibility exists that you could sustain a loss of some or all of your initial investment and therefore you should not invest money that you cannot afford to lose. You should be aware of all the risks associated with foreign exchange trading, and seek advice from an independent financial advisor if you have any doubts.

Join Telegram

Follow us on Telegram

Stay updated of all the news

Join Telegram

Recommended content


Follow us on Telegram

Stay updated of all the news

Join Telegram

Recommended Content

Editors’ Picks

VeChain Price Prediction: VET bears eye 10% correction

VeChain Price Prediction: VET bears eye 10% correction

VeChain price is slowly undoing the gains witnessed in the second and third weeks of September. If this trend continues, VET could stand to trigger a steep correction in the near future.

More VeChain News

Bitcoin Cash Price Forecast: BCH traders can bank on short-term bounce to $228

Bitcoin Cash Price Forecast: BCH traders can bank on short-term bounce to $228

Bitcoin Cash (BCH) price presents an opportunity that could profit traders who are bullish on the short term. Additionally, investors might get a better chance to accumulate due to a pullback to a key support level. 

More Bitcoin Cash News

Shiba Inu inspired meme coin BONE notes first rise following the 55% crash in two months

Shiba Inu inspired meme coin BONE notes first rise following the 55% crash in two months

Bone ShibaSwap price, at the time of writing, was just above $0.82, marking the first green candle since the beginning of August. Selling pressure concerning BONE is rather intense in the market, however, no major dump has been observed.

More Cryptocurrencies News

Binance reopens Belgium operations after three months of suspension by FSMA

Binance reopens Belgium operations after three months of suspension by FSMA

Binance Exchange has reopened registrations for its Belgian community to access its products and services. The restoration comes with new “Terms of Use”, as the platform looks to steer clear of regulatory mishaps.

More Binance news

Bitcoin: BTC downside likely after 20-week EMA culls bulls

Bitcoin: BTC downside likely after 20-week EMA culls bulls

Bitcoin (BTC) bearish price fractal, as discussed in a previous article, is underway, but the lack of volatility is causing ambiguity and doubt. Regardless, BTC might see a bit of an upside before the long-term bearish scenario plays out.

Read full analysis

BTC

ETH

XRP