Basic Attention Token Technical Analysis: BAT whales on a buying spree despite bearish signs
- BAT non-exchange wallet holders increase their accumulation following the dip earlier this month.
- On-chain metrics suggest that the path of least resistance is downwards until formidable support is found.

Basic Attention Token, like many other cryptocurrencies in the market, is in the middle of a retreat following the losses posted in the first week of September. Although support at $0.22 came in handy, recovery has not been rapid as investors expected. Resistance at $0.28 has continued to give the bulls are a hard time, hence delaying recovery.
Why are BAT large volume holders stocking up?
Santiment, a leading provider of on-chain data in the industry, says Basic Attention Token whales “appear to be back to accumulating.” The large non-exchange wallets are perhaps buying the dip in anticipation that BAT will reverse the trend and embark on a massive rally to $3.5.
Top non-exchange holders of BAT
 [06.33.22, 16 Sep, 2020]-637358272868681008.png)
According to the data, the amount held by top non-exchange addresses has increased significantly from 359.51 million BAT on September 8 to 376.33 million BAT on September 15. There was a spike to 392.86 million on September 14, but some wallets offloaded some coins. Generally, whales are accumulating, and in due course, this could lead to a reversal in the price.
$BAT's top 10 non-exchange addresses appear to be back to accumulating. The 393M tokens held is the highest amount in these whale addresses since July 10th. In a 48-hour span, these whales have added ~9% more tokens to their holdings! Watch carefully. https://t.co/qtW5g3mwc8 pic.twitter.com/vX38hoPFIj
— Santiment (@santimentfeed) September 15, 2020
Basic Attention Token technical analysis
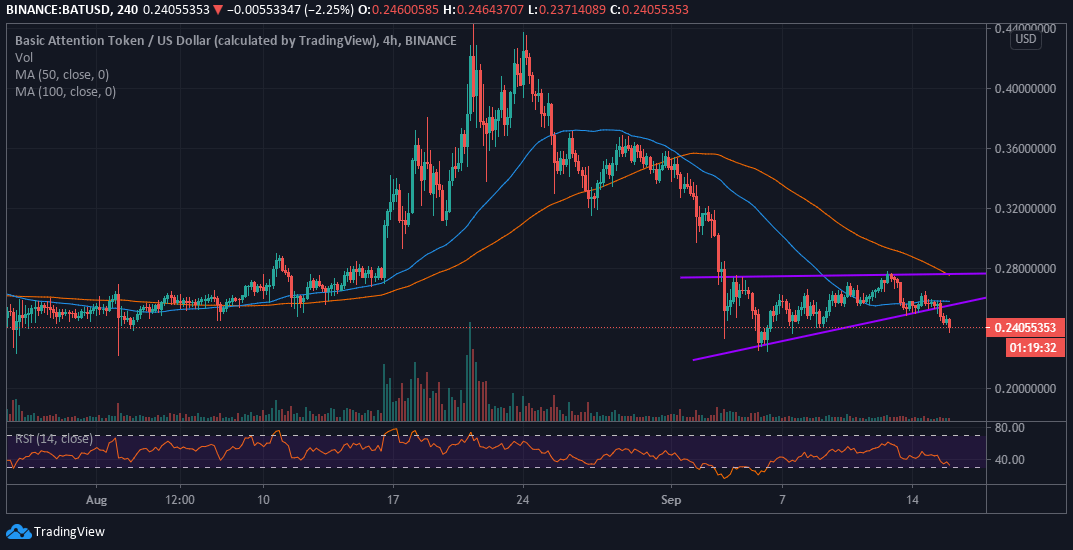
The stubborn resistance at $0.28 led to an ascending triangle, as seen in the chart below. Ascending triangles are common patterns in technical analysis. A horizontal line is drawn alongside the highs made by the asset, while an ascending trendline is drawn to mark the lows. Breakout from these patterns can be either up or down. However, ascending triangles tend to signal the continuation of the trend before.
For instance, the BAT/USD 4-hour chart's ascending triangle seems to be continuing the downtrend before the pattern. The declines are currently supported by the Relative Strength Index (RSI) as it dives towards the oversold (30 and below). If support at $0.24 caves in, we can expect BAT to extend the lower leg back to September’s support at $0.22.
BAT/USD 4-hour chart
Basic Attention Token on-chain analysis
The IOMAP metric by IntoTheBlock highlights the struggle BAT is bound to face in its recovery. The initial resistance at 0.24 - $0.25 seems relatively easy to bring down considering the 12,050 addresses that previously bought 24.82 million BAT in the range. Unfortunately, the price action above this zone will run into extreme selling pressure between $0.25 and $0.26. Only when this zone is flipped into support is that the price can rally to $0.35.
IntoTheBlock IOMAP
-637358277686507028.png)
On the flip side, initial support between $0.23 and $0.24 does not seem strong enough to hold BAT, at least not for long. Note that 12,630 addresses had previously purchased 40.62 million BAT in this zone. A retreat below this first support area could see BAT spiral to the major support at $0.2130 - $0.22, where 9,020 addresses bought a 142.82 million BAT.
The decrease in the number of new addresses also validates the bearish notion. IntoTheBlock shows that the new addresses created on the network dropped from 1,170 on September 13 to 966 on September 15. The downward trend signals a higher probability of continuing bearish price action.
BAT new addresses
-637358278080920193.png)
Looking at the other side of the fence
Although most of the indicators are bearish for BAT, there is a likelihood of the whales currently accumulating becoming the ultimate winners, especially if the double-bottom pattern in the hourly range comes into play as expected. Support at $0.24 will have to hold water while bulls shift their focus to the critical resistance between $0.25 and $0.27. The short term recovery is also highlighted by the Relative Strength Index (RSI) as it moves closer to the midline.
Author

John Isige
FXStreet
John Isige is a seasoned cryptocurrency journalist and markets analyst committed to delivering high-quality, actionable insights tailored to traders, investors, and crypto enthusiasts. He enjoys deep dives into emerging Web3 tren


