Avalanche price could print one more low before a buy opportunity presents
- Avalanche price lost 40% of its market value in November.
- Several signals suggest the market bottom.
- Invalidation of the bearish thesis is a breach above $14.

Avalanche price witnessed a devastating plummet in November. On November 21, the bears forged new monthly lows bringing the market losses to 44%. As bulls try to retaliate, traders must decide which side of the trend they want to join.
AVAX price takes a hit
Avalanche price has seen better days as the Ethereum-based gaming token fell by 40% in November. Now, as the bulls try to retaliate against the bearish onslaught, the technicals hint that a secure low still needs to be in for the AVAX price.
Avalanche price now auctions at $12.72. The bears have established a new monthly low at $11.45. The new low shows less volume than the previous downtrend, which forged the previous monthly low at 11.92. The Relative Strength Index (RSI) shows a bullish divergence between the two lows, likely enticing traders to open a long position and aim for the 21-day simple moving average at 14.67.
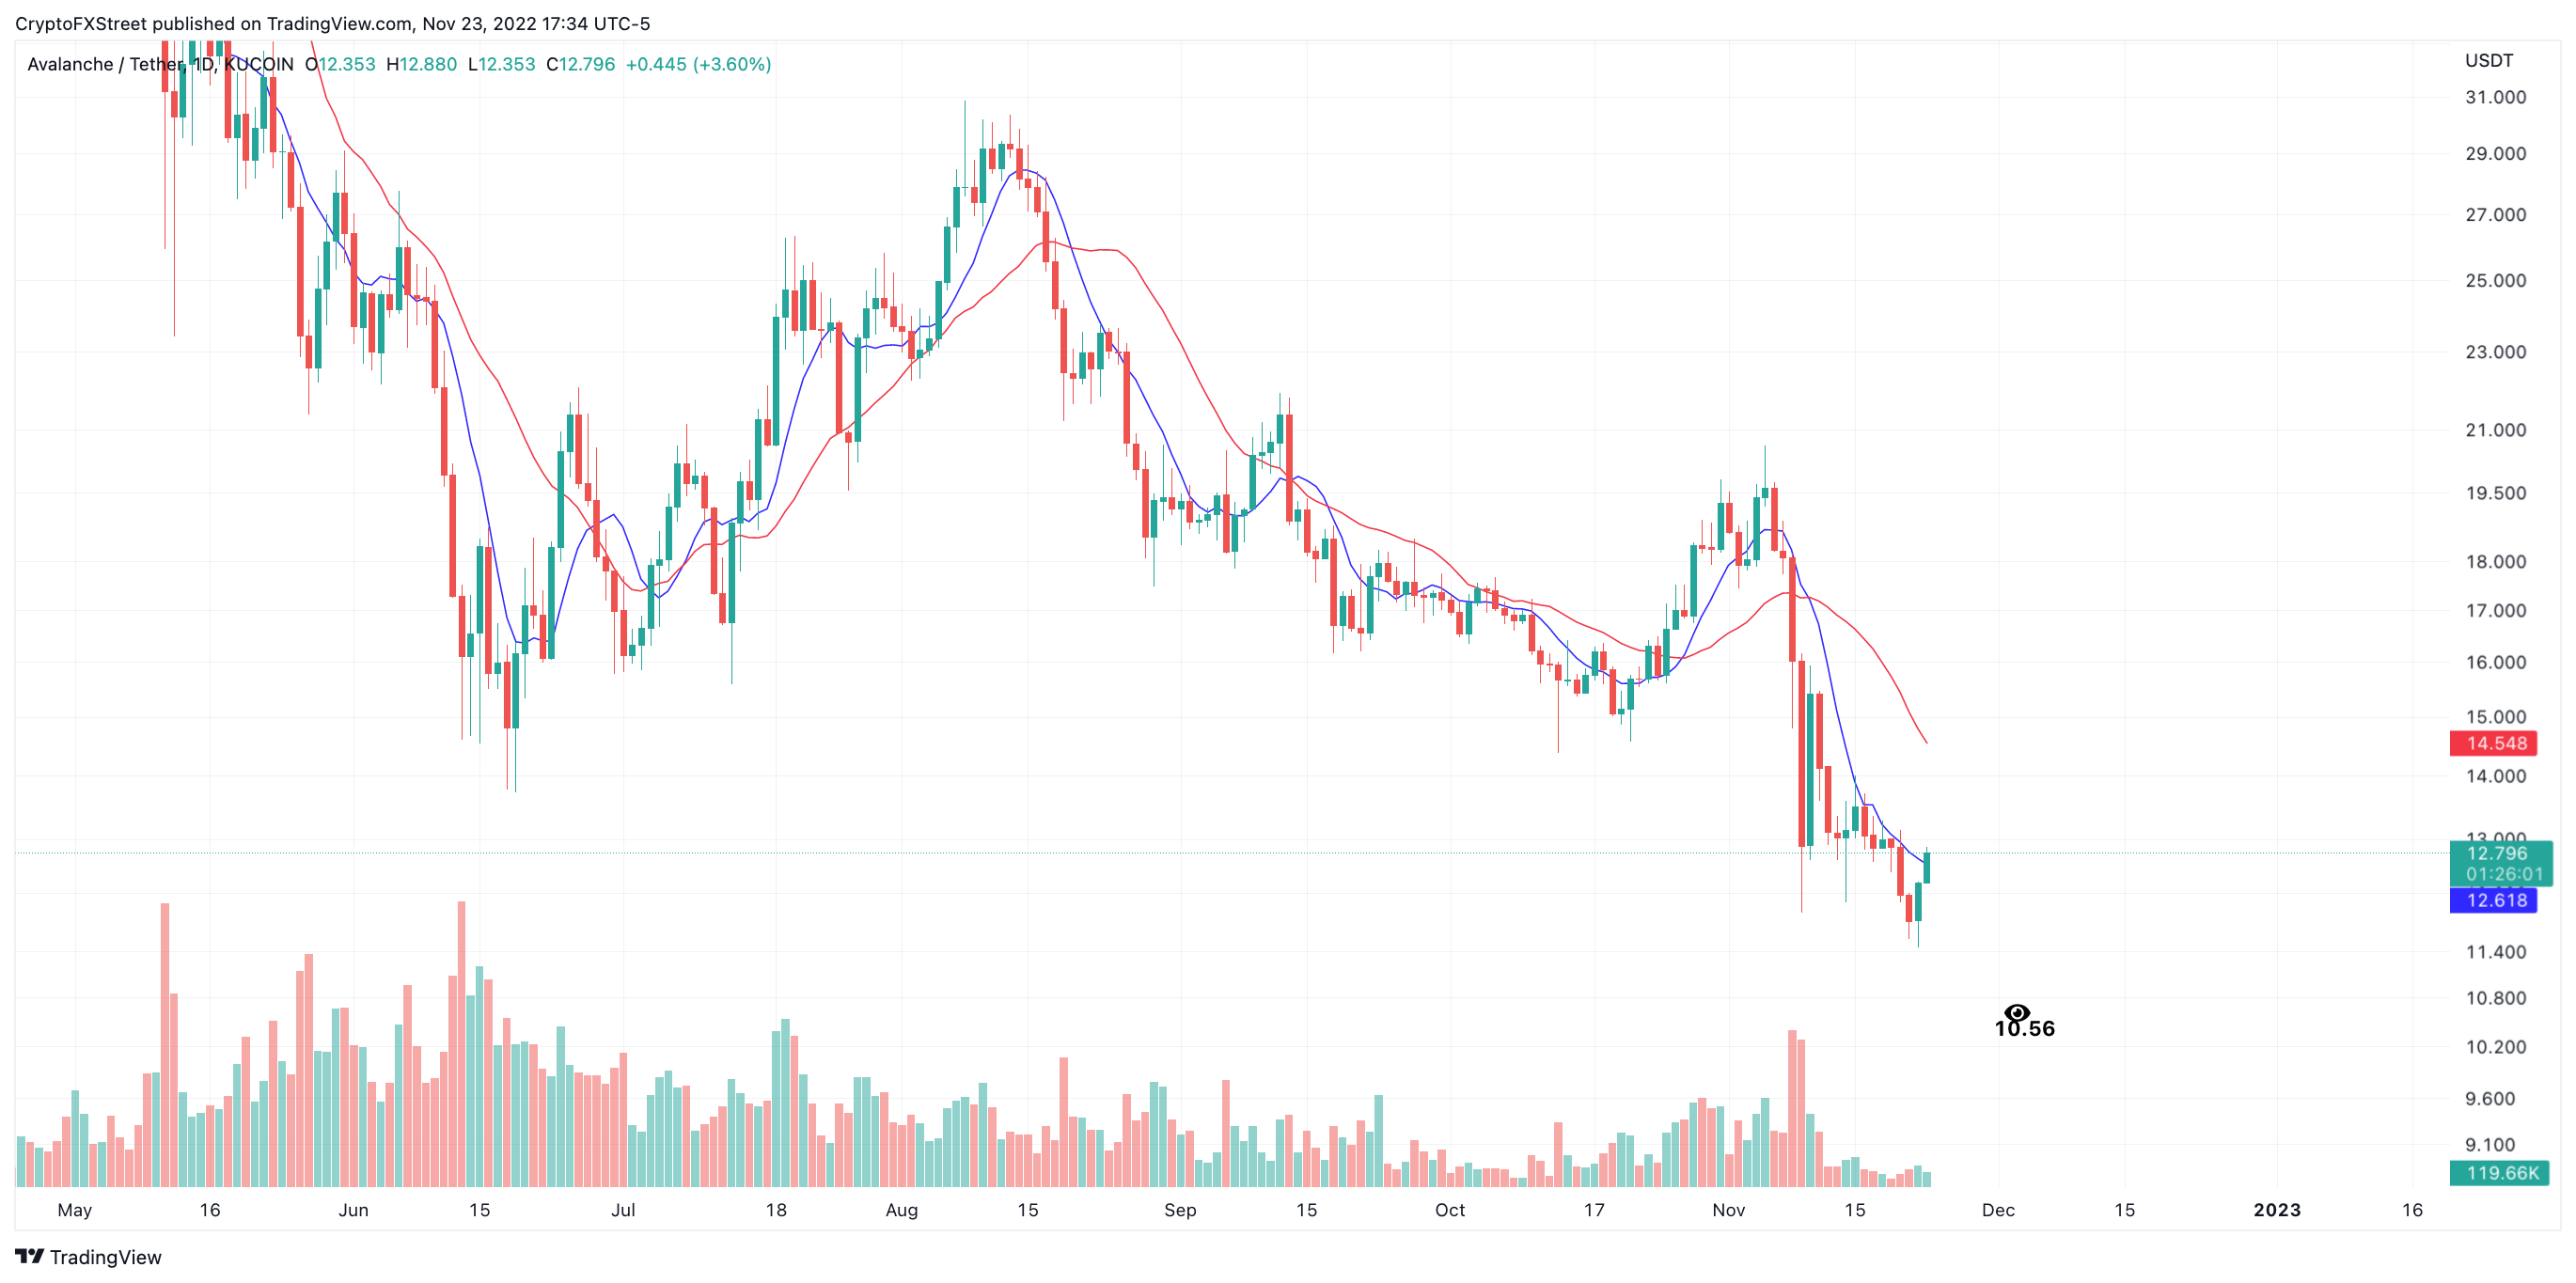
AVAX USDT 1-Day Chart
Still, traders should be very careful as the 8-day exponential moving average still stands in the way of the bulls' ambition. Additionally, the volume near the newfound lows does not show reversal signals. This thesis proposes one more low will occur for the AVAX price in the coming days. Targets lie between $10.50 and $10.70
In summary, Avalanche's price may be due to one more daily decline. Traders may want to practice healthier risk management techniques as the market could be subject to increased volatility.
Invalidation of the bearish thesis could arise if the bulls breach the swing high at $14. AVAX could re-route north in the short term if the level is breached and rallies as high as $24. Such a move would result in a 100% increase from the current Avalanche price.
In the following video, our analysts deep dive into the price action of Bitcoin, analyzing key levels of interest in the market. -FXStreet Team
Author

Tony M.
FXStreet Contributor
Tony Montpeirous began investing in cryptocurrencies in 2017. His trading style incorporates Elliot Wave, Auction Market Theory, Fibonacci and price action as the cornerstone of his technical analysis.


