Algorand Price Prediction: ALGO kickstarts 38% correction
- Algorand price has formed a bearish chart pattern, projecting a 38% correction on the horizon.
- The bears could push ALGO to as low as $0.50 following a slice below a critical line of defense.
- Algorand must revisit $0.94 in order to invalidate the bearish thesis

Algorand price has kickstarted a massive decline following the emergence of a bearish chart pattern. ALGO fell below a critical line of defense at $0.81, putting the pessimistic target on the radar.
Algorand bears target $0.50 next
Algorand price has sliced below the lower boundary of the descending triangle pattern on the 12-hour chart, triggering a 38% collapse that could send ALGO lower toward $0.50, a bearish target given by the prevailing chart pattern.
The first line of defense for Algorand price is at the June 23 low at $0.71, then toward the June 21 low at $0.67. An additional increase in selling pressure may push ALGO lower toward the 127.2% Fibonacci extension level at $0.62.
A spike in bearish sentiment may continue to drive Algorand price to reach the pessimistic target at $0.50, resulting in a 38% drop from the lower boundary of the governing technical pattern.
However, if the bulls come to the rescue, Algorand price may target the downside trend line of the descending triangle pattern at $0.81, before attempting to reach the 21 twelve-hour Simple Moving Average (SMA) at $0.89, which coincides with the 78.6% Fibonacci retracement level.
An additional surge in buy orders may see Algorand price reach the 50 twelve-hour SMA at $0.94, intersecting with the upper boundary of the prevailing chart pattern.
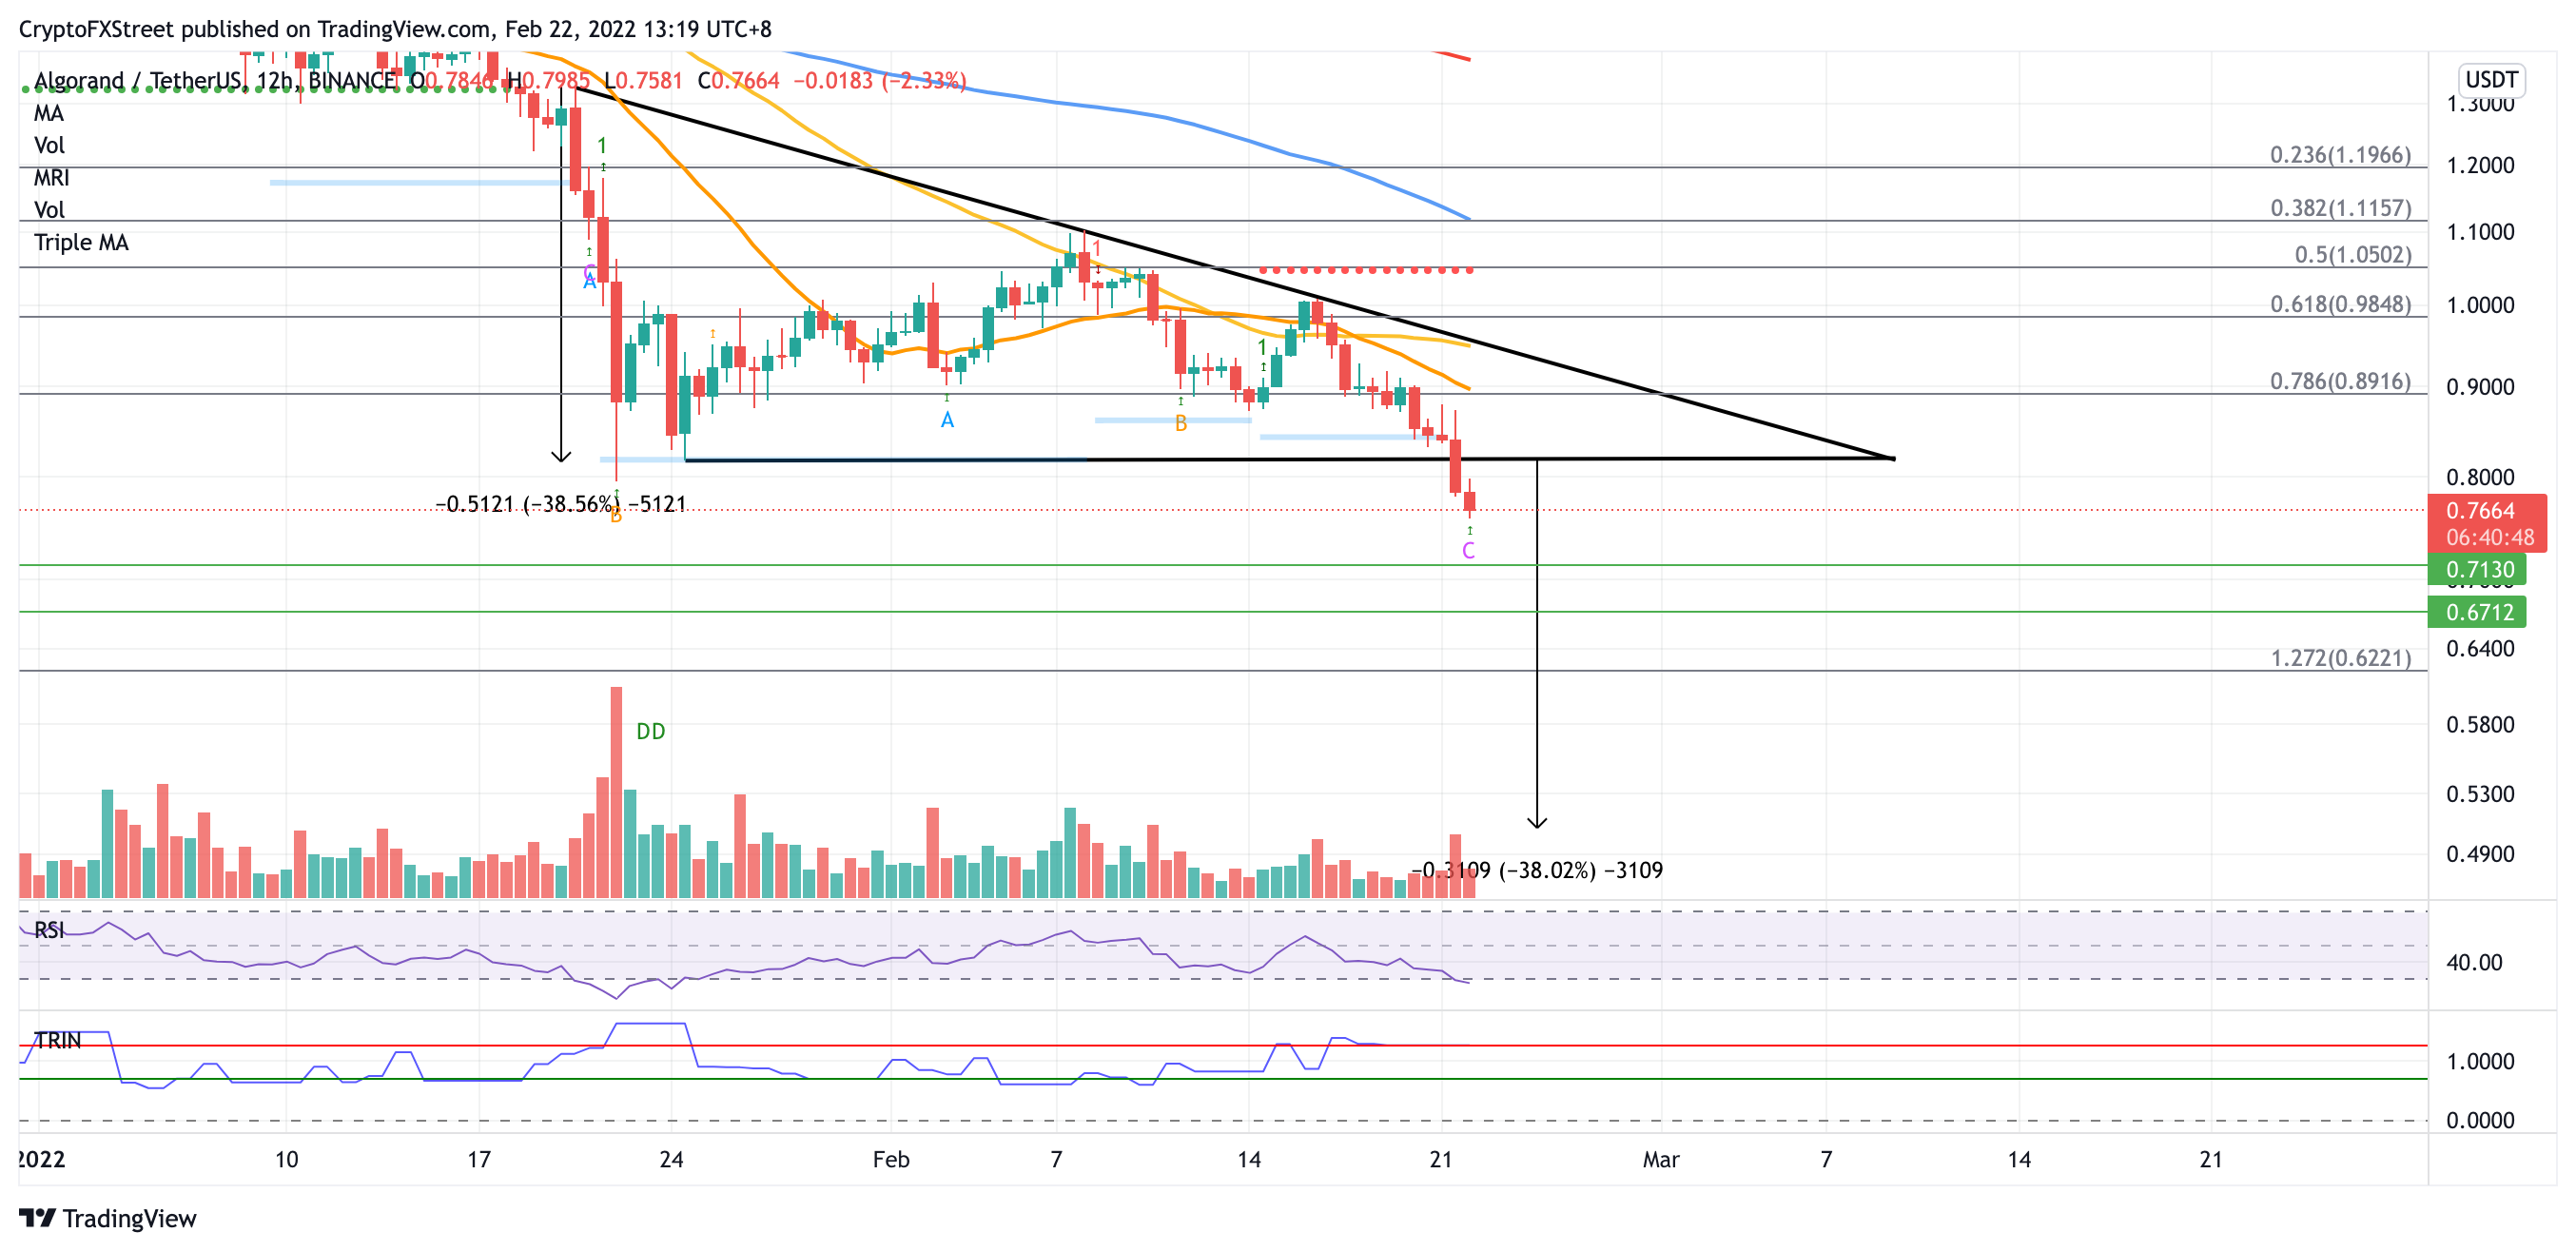
ALGO/USDT 12-hour chart
If Algorand price slices above the topside trend line of the governing technical pattern, the bearish narrative may be invalidated.
Algorand price may continue to move higher, targeting the 50% retracement level at $1.05 next, where the resistance line is given by the Momentum Reversal Indicator (MRI) also sits.
Bigger aspirations will target the 38.2% Fibonacci retracement level at $1.11, intersecting with the 100 twelve-hour SMA.
Author

Sarah Tran
Independent Analyst
Sarah has closely followed the growth of blockchain technology and its adoption since 2016.


