AAVE price is poised for a 20% rally if support levels hold
- Aave price is retesting the support area between $117.53 and $112.48, eyeing a reversal ahead.
- On-chain data paints a bullish picture as AAVE’s long-to-short ratio is above one, and the NPL metric spikes negative.
- A daily candlestick close below $112.48 would invalidate the bullish thesis.

Aave (AAVE) price is retesting its major support level and bounces 5.5% higher at the time of writing on Wednesday. On-chain data supports the bullish thesis and hints for a rally ahead, as exhibited by AAVE’s long-to-short ratio above one and the Network Realized Profit/Loss (NPL) indicator showing a negative spike.
AAVE price looks promising
Aave price is retesting its support area between $117.53 and $112.48. This area could serve as a major support zone, roughly coinciding with three key levels.
- The daily support level is $117.53.
- The 50-day Exponential Moving Average (EMA) hovers around $113.75.
- The 50% price retracement from a low in early August to a high in late August at $112.48.
At the time of writing on Wednesday, AAVE retests the support area and bounces 5.5% higher to trade at $123.17.
If this support area holds, AAVE could rally 20% to restest its daily resistance at $142.69.
The Relative Strength Index (RSI) on the daily chart is flipping over its neutral level of 50, and the Awesome Oscillator (AO) still trades above its neutral level of zero. If bulls are indeed returning, then both momentum indicators must maintain their positions above their respective neutral levels. Such a development would add a tailwind to the recovery rally.
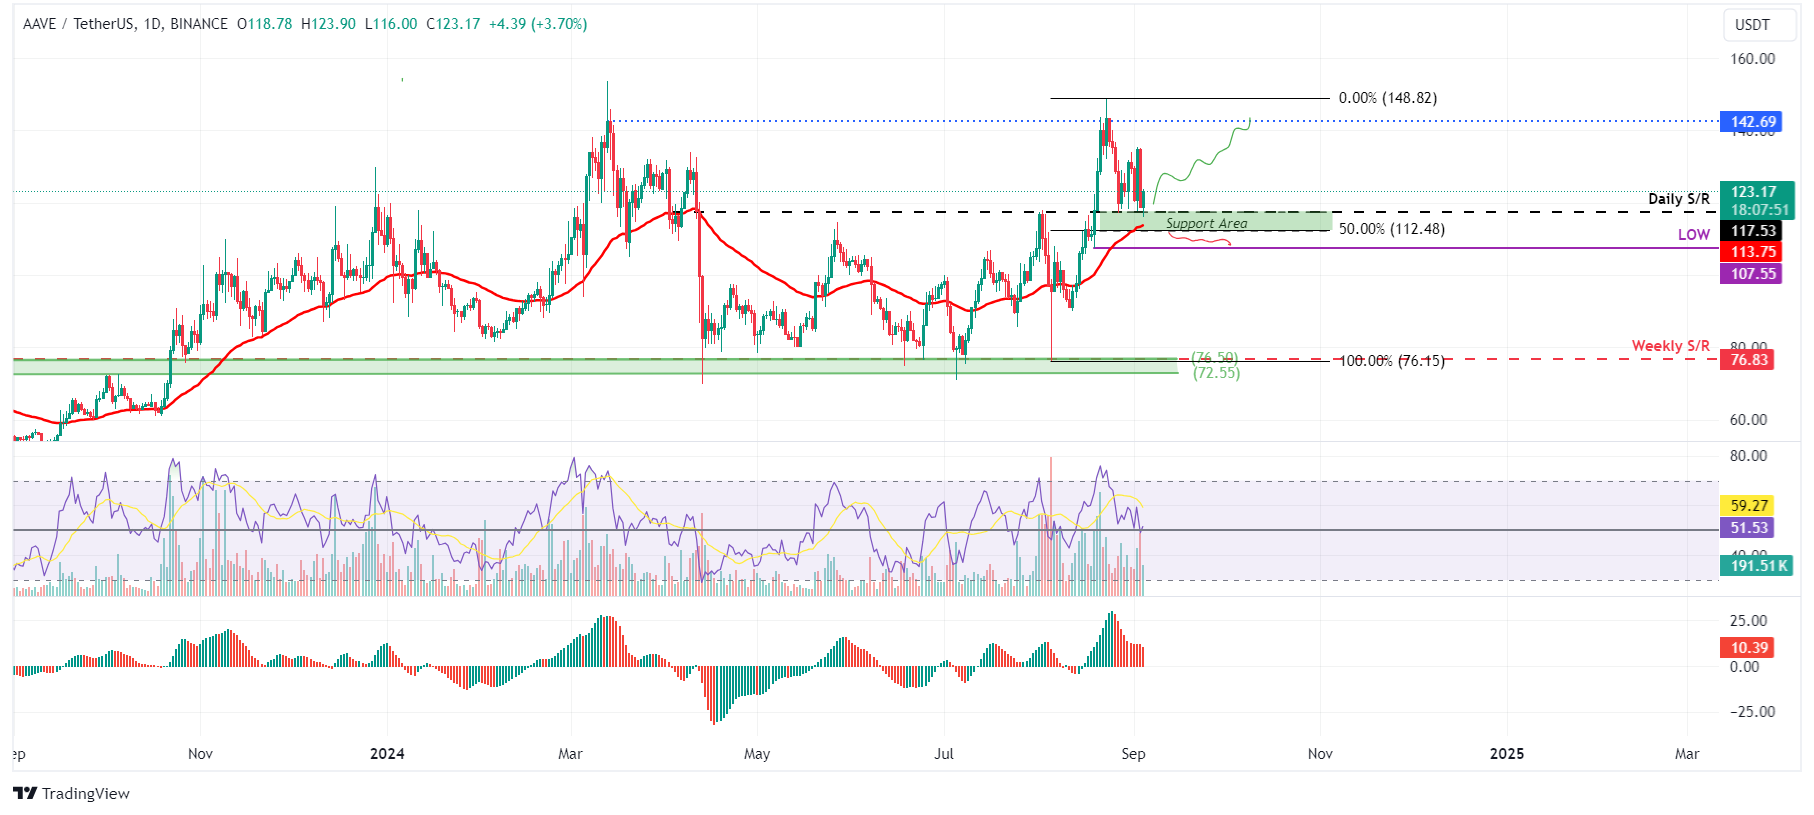
AAVE/USDT daily chart
Coinglass’s AAVE long-to-short ratio also stands at 1.04, supporting the bullish outlook. This ratio reflects bullish sentiment in the market, as the number above one suggests that more traders anticipate the price of the asset to rise.
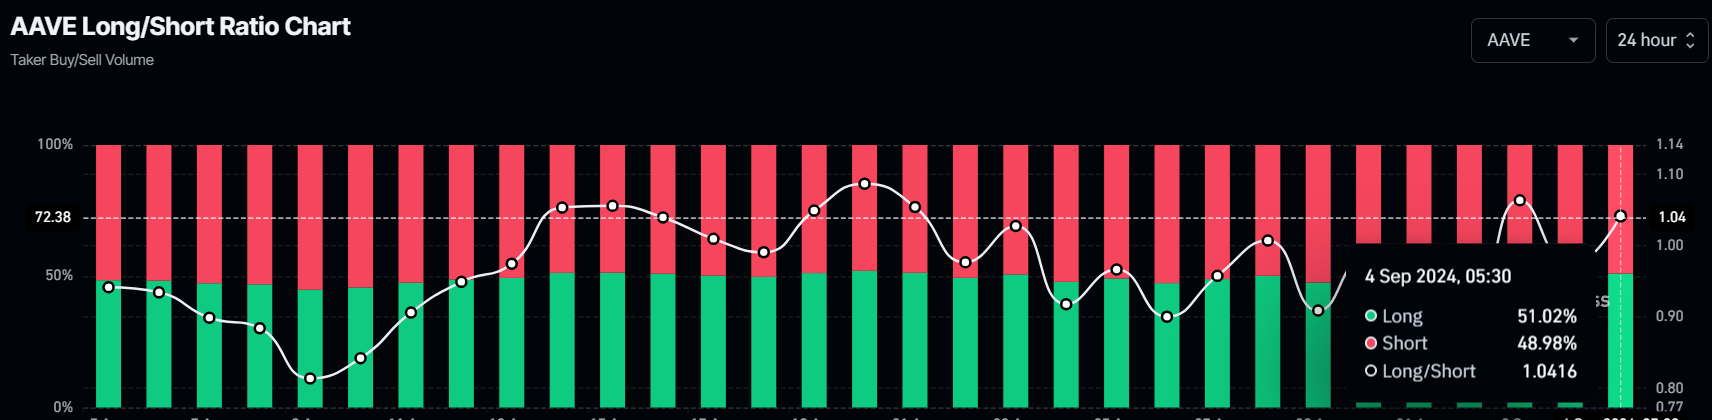
AAVE long-to-short ratio chart
On-chain data provider Santiment’s Network Realized Profit/Loss (NPL) indicator measures a daily network-level Return On Investment (ROI) based on the coin’s on-chain transaction volume. Generally, it is used to measure market pain. Strong spikes in a token’s NPL indicate that its holders are, on average, selling their bags at a significant profit. On the other hand, strong dips imply that the coin’s holders are, on average, realizing losses, suggesting panic sell-offs and investor capitulation.
The NPL indicator dipped from 853,290 to -1.67 million from Tuesday to Wednesday in AAVE’s case. This negative downtick indicates that the holders were, on average, realizing losses.
However, during the same period, AAVE’s supply on exchanges declined by 2%. This decrease in supply on exchanges indicates that investors are moving AAVE tokens to wallets and reducing selling activity, signaling a bullish outlook and further denoting investor confidence in AAVE.
%20[09.40.53,%2004%20Sep,%202024]-638610294598004011.png)
AAVE Network Realized Profit/Loss and Supply on Exchange chart
Despite the bullish thesis signaled by both on-chain data and technical analysis, the outlook will shift to bearish if AAVE’s daily candlestick closes below the lower band of the support zone at 112.48. This scenario could lead to a 4% decline to retest its August 19 low of $107.55.
Author

Manish Chhetri
FXStreet
Manish Chhetri is a crypto specialist with over four years of experience in the cryptocurrency industry.


