AAVE price poised for a rally as on-chain data shows positive bias
- Coinglass open interest is rising and is at its highest this year, indicating an influx of new money.
- Santiment daily active addresses are rising, signaling a bullish move.
- Investors should be cautious about spikes in the Network Realized Profit/Loss metric.

AAVE (AAVE) has surged 15% since Monday and is maintaining its upward momentum with a 3.5% increase to $133.42 for the third straight day on Wednesday. On-chain data shows that AAVE's open interest data and daily active addresses are rising, signaling the continuation of the bullish trend.
AAVE price gains traction as on-chain data suggests a positive trend
Data from CoinGlass shows that the futures' Open Interest (OI) in AAVE at exchanges is also increasing. The OI indicates the total number of outstanding derivative contracts that have not been settled (offset by delivery) and whether money flows into the contract are increasing or decreasing.
Increasing OI represents new or additional money entering the market and new buying, which suggests a bullish trend. When OI decreases, it is usually a sign that the market is liquidating, more investors are leaving, and the current price trend is ending.
The graph below shows that AAVE's OI increased from $106.24 million on Monday to $177.55 million on Wednesday, the highest OI since the start of this year. This indicates that new or additional money is entering the market and new buying is occurring.
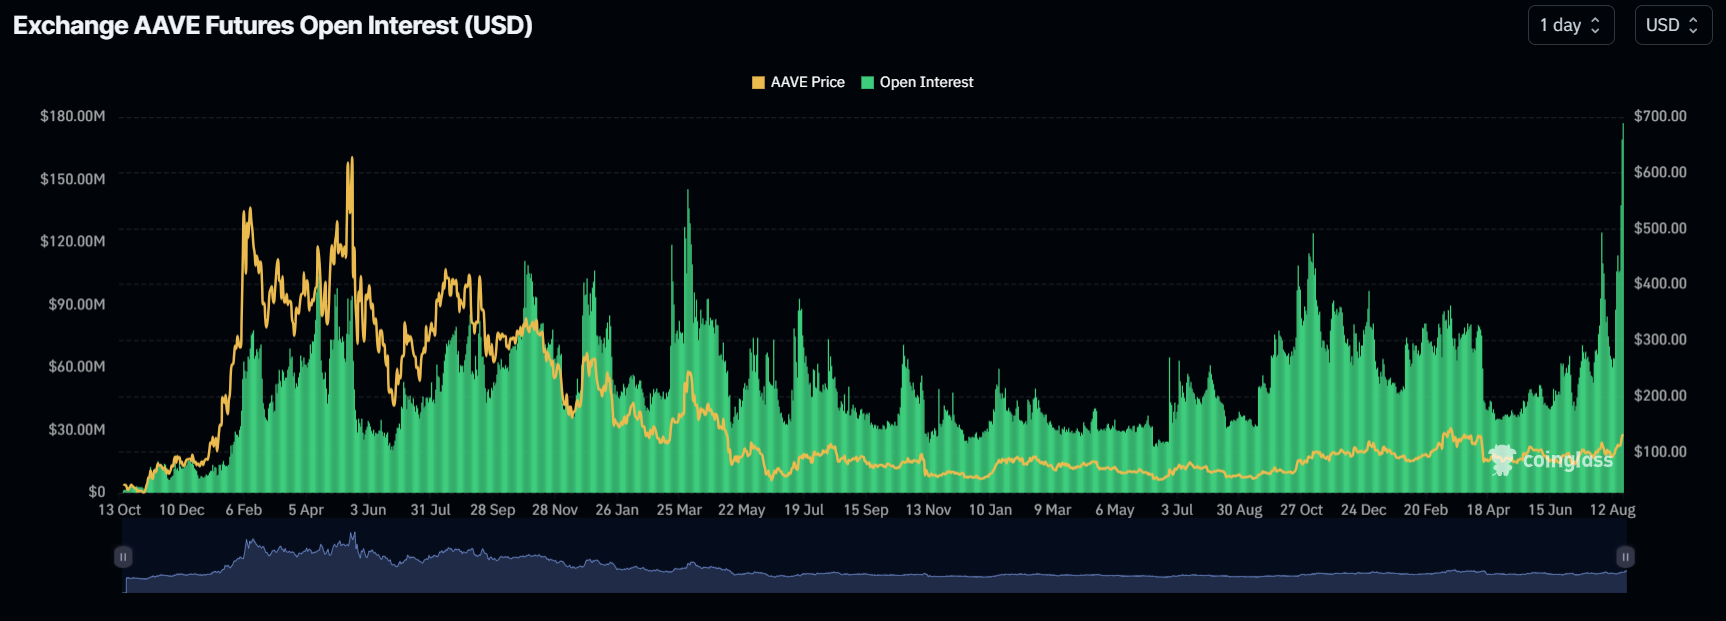
AAVE Open Interest chart
Santiment's Daily Active Addresses index helps to track network activity over time. A rise in the metric signals greater blockchain usage, while declining addresses point to lower demand for the network.
In AAVE's case, Daily Active Addresses have risen by 65% from Monday to Wednesday. This rise is the highest since the end of December 2023 and indicates that demand for AAVE's blockchain usage is increasing, which could propel a rally in AAVE's price.
%20[10.01.19,%2021%20Aug,%202024]-638598168928529267.png)
AAVE Daily Active Addresses chart
Additionally, Coinglass's long-to-short ratio stands at 51.06%. This ratio suggests a bullish sentiment in the market, as the number above 50% suggests that more trades anticipate that the price of AAVE will rise.
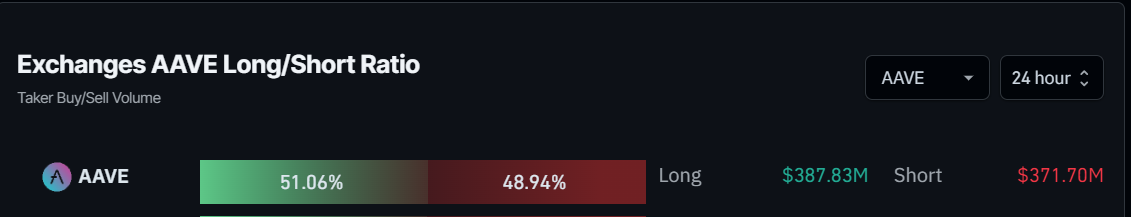
AAVE long-to-short ratio chart
Despite new buying, greater blockchain usage, and increasing bullish sentiment, AAVE's Network Realized Profit/Loss metric shows an upward spike. This indicates that its holders are, on average, selling their holdings at a significant profit. Consequently, investors should not anticipate an immediate price rally for the token.
%20[10.11.32,%2021%20Aug,%202024]-638598169538573923.png)
AAVE Network Realized Profit/Loss chart
Author

Manish Chhetri
FXStreet
Manish Chhetri is a crypto specialist with over four years of experience in the cryptocurrency industry.


