AAVE is poised for a decline if it closes below this key support level
- AAVE's price is trading below its daily support level at $142.69; a firm close below would suggest a decline ahead.
- Santiment's Network Realized Profit/Loss data shows investors are booking profits.
- A daily candlestick close above $164.32 would invalidate the bearish thesis.

Aave (AAVE) shows weakness on Wednesday, trading in the red after a loss of over 7% the previous day. It is currently trading below a key support level, and a sustained close beneath this level could indicate further declines. Additionally, AAVE's Network Realized Profit/Loss data shows that investors are taking profits, suggesting a potential price decline in the coming days.
AAVE price shows signs of weakness
AAVE price broke below the ascending trendline (drawn by connecting multiple low levels for mid-August) on Tuesday. As of Wednesday, it continues to trade down around $141.19, breaking below its daily support level of $142.69.
Suppose AAVE's price closes below its $142.69 daily support and its 50-day Exponential Moving Average (EMA) around $139.47. It could extend its decline by 17% from its current trading level to retest its 61.8% Fibonacci retracement (drawn from an early August low of $76.15 to its late September high of $180.70) at $116.09.
The Moving Average Convergence Divergence (MACD) indicator further supports AAVE's fall, signaling a bearish crossover on Monday. The MACD line has moved below the signal line to provide us with a sell signal. It also shows red histogram bars below the neutral line at zero, suggesting that AAVE's price could experience downward momentum.
Additionally, the Relative Strength Index (RSI) on the daily chart has fallen sharply to 43, below its neutral level of 50. A cross to levels below the neutral level generally indicates that bearish momentum is gaining traction.
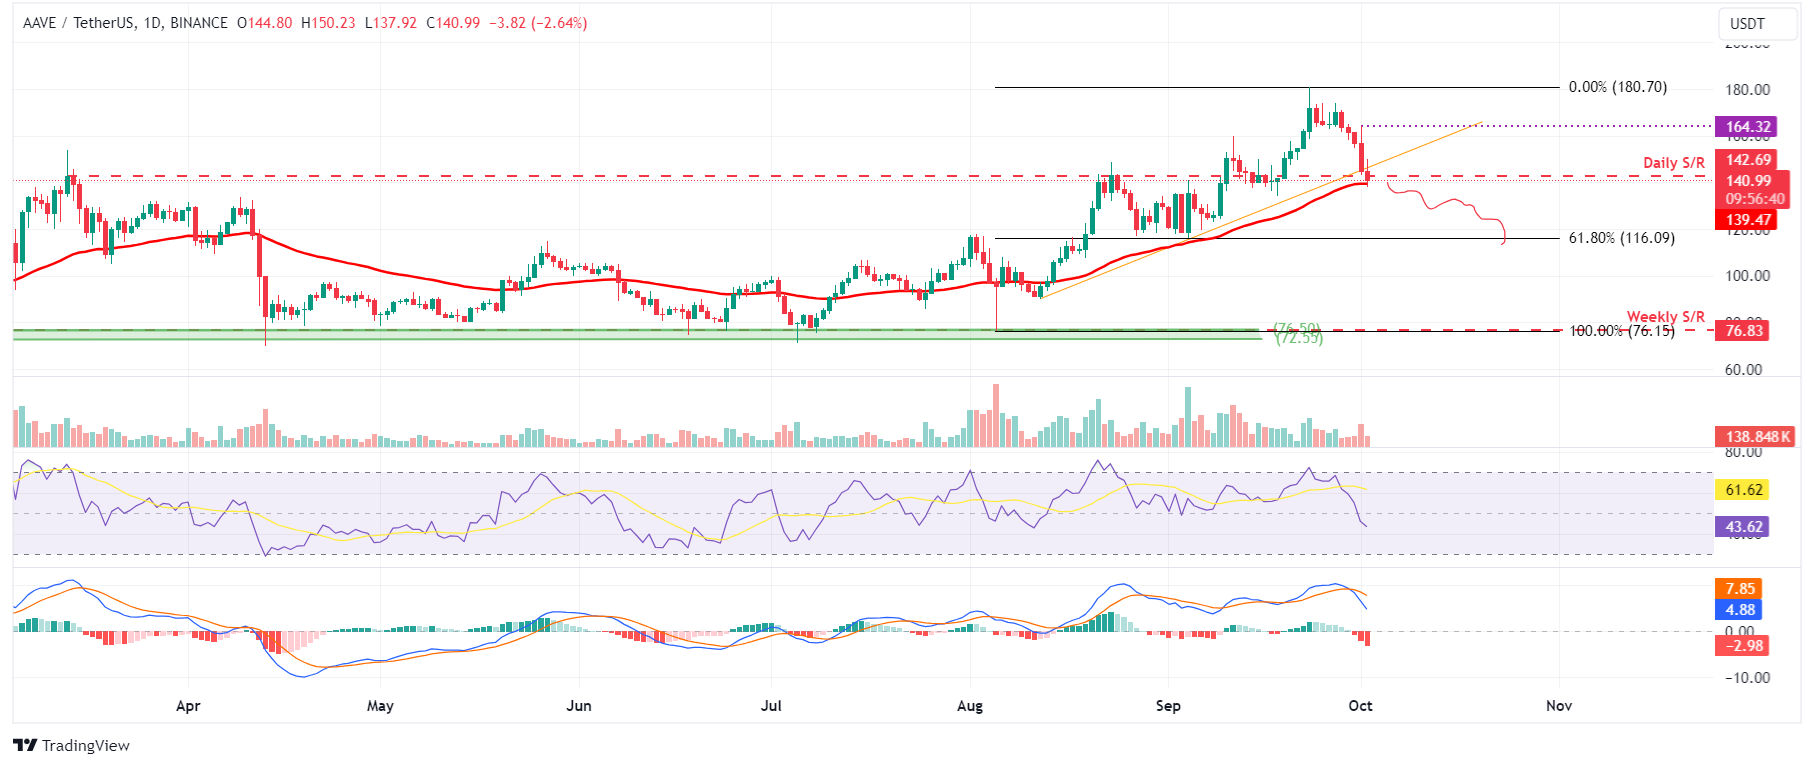
AAVE/USDT daily chart
Aave's Network Realized Profit/Loss (NPL) indicator also aligns with the bearish outlook. This metric computes a daily network-level Return On Investment (ROI) based on the coin's on-chain transaction volume. Simply put, it is used to measure market pain. Strong spikes in a coin's NPL indicate that its holders are, on average, selling their bags at a significant profit. On the other hand, strong dips imply that the coin's holders are, on average, realizing losses, suggesting panic sell-offs and investor capitulation.
In AAVE's case, the NPL indicator spiked from 2.33 million to 7 million from September 22 to September 23 and from 3.58 million to 5.17 million from September 26 to September 27, respectively. These upticks indicate that the holders were, on average booking their profits and increasing the selling pressure.
%20[17.24.35,%2002%20Oct,%202024]-638634773862384733.png)
AAVE Network Realized Profit/Loss chart
Even though on-chain metrics and technical analysis support the bearish outlook, if AAVE makes a daily candlestick close above $164.32, the bearish technical thesis would be invalidated by creating a higher high on the daily chart. This development could see AAVE's price rise by 10% to retest its September 23 high of $180.70.
Author

Manish Chhetri
FXStreet
Manish Chhetri is a crypto specialist with over four years of experience in the cryptocurrency industry.