Top 3 Price Prediction Bitcoin, Ethereum, Ripple: Bitcoin dips below $61,000 amid escalating tensions between Israel and Iran
- Bitcoin price falls below its key support level of $62,000, signaling weakness in bullish momentum.
- Ethereum price closes below its daily support level at $2,461, suggesting a decline ahead.
- Ripple price retests its 50-day EMA at $0.578; a firm close below would suggest a decline ahead.

Bitcoin (BTC) and Ethereum (ETH) have closed below their key support levels, signaling a potential decline ahead, while Ripple (XRP) is retesting its crucial support level, with a break below likely indicating further downside.
Bitcoin shows signs of weakness as it closes below $62,000 support level
Bitcoin price was rejected from its psychologically important $66,000 level on Saturday and declined more than 7% over the next three days, closing below its support level of $62,000. As of Wednesday, it is recovering slightly, trading around $61,800.
If Bitcoin declines further and closes below its 200-day Exponential Moving Average (EMA) at $59,895, it could extend its decline to retest its September 17 low of $57,610.
The daily chart’s Relative Strength Index (RSI) supports this decline in Bitcoin’s price. It trades at 49, below its neutral level of 50, indicating a weakening in bullish momentum. If the RSI continues to stay below 50, selling pressure will be reflected on the indicator.
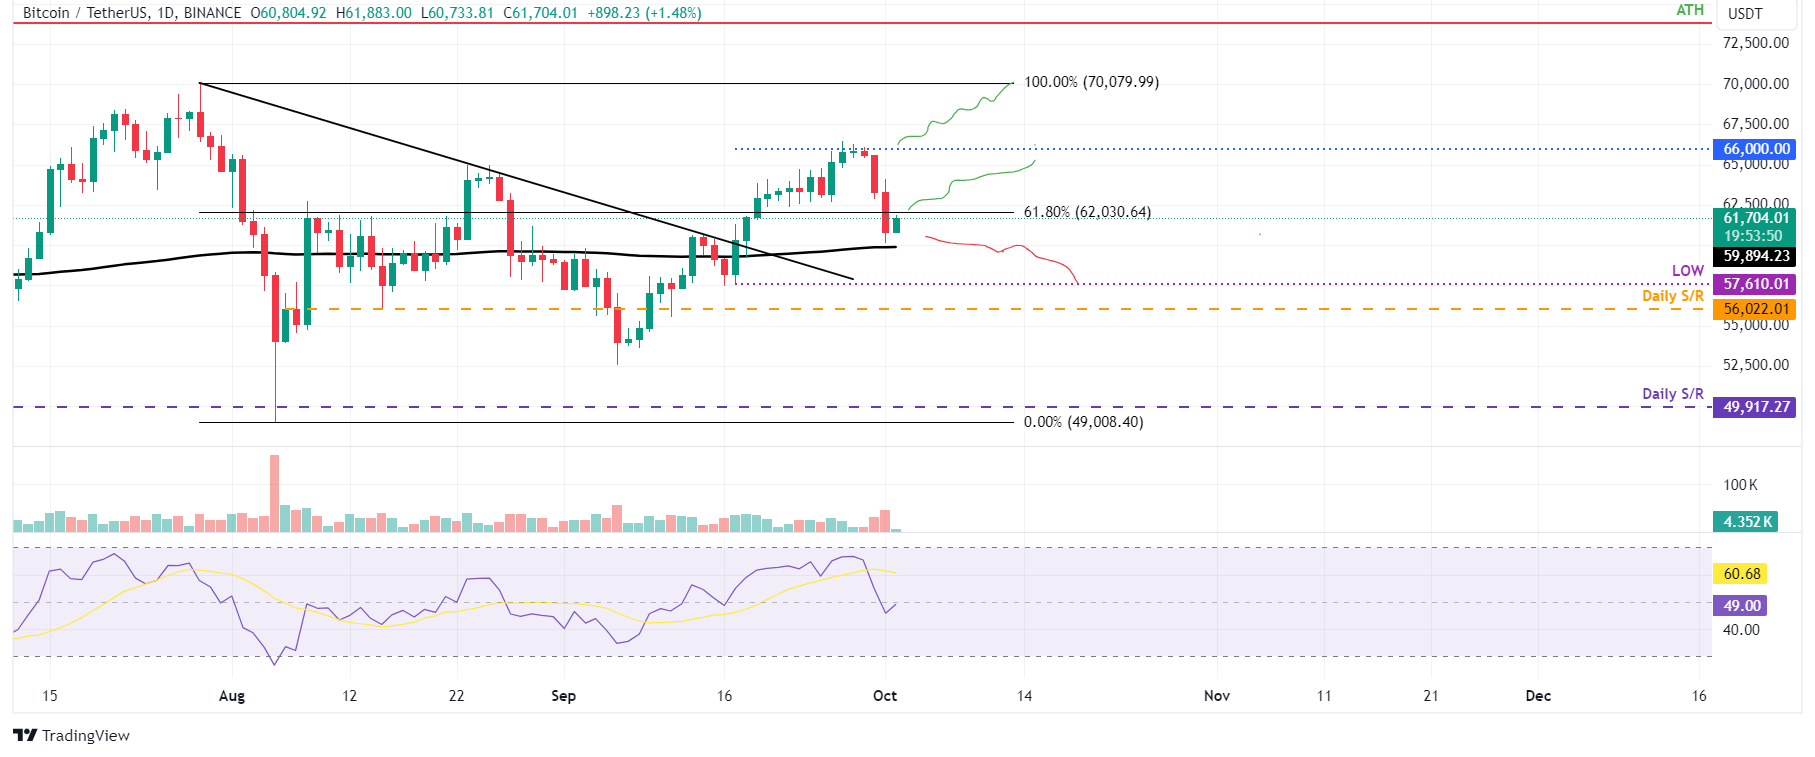
BTC/USDT daily chart
On the other hand, If BTC rises, closing above the $62,000 level, it could resume the rally to retest its next resistance at $66,000.
Ethereum is set for a downturn as it closes below its key support level
Ethereum price broke below its 50-day EMA at $2,591 and closed below its daily support level of $2,461 on Tuesday. On Wednesday, it hovers around $2,484.
If the $2,461 level acts as resistance, ETH could continue its decline to retest its September 6 low of $2,155.
The RSI on the daily chart supports Ethereum’s decline. It trades at 46, below its neutral level of 50, suggesting bearish momentum and a further decline in ETH is on the cards.
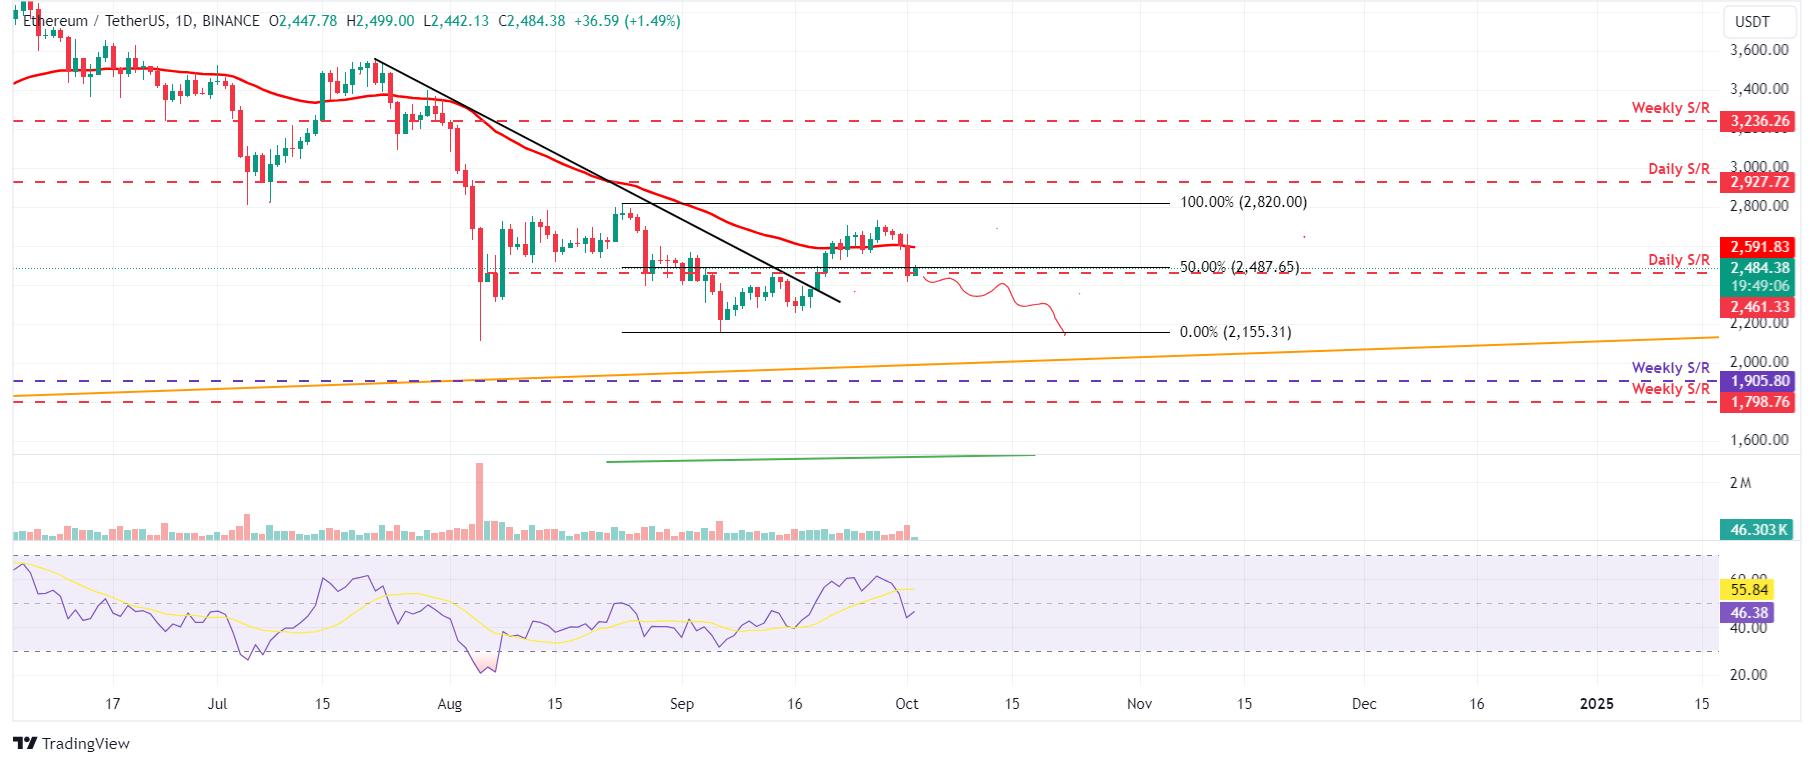
ETH/USDT daily chart
However, if ETH's daily candlestick breaks above the $2,461 level and closes above its 50-day EMA at $2,591, the rally would see a revival to retest its August 24 high of $2,820.
Ripple price is poised for a decline if it closes below its 50-day EMA
Ripple price was rejected by the $0.657 level on Sunday and declined by 7.35% over the next two days, closing below its daily support level at $0.626. On Wednesday, it trades slightly higher at $0.601 after finding support around its 50-day EMA at $0.578 on Tuesday.
If XRP closes below the 50-day EMA at $0.578, it could continue its decline to retest its next daily support at $0.544.
The RSI on the daily chart has declined and is trading at 54, suggesting a slowdown of bullish momentum. However, If it continues to decline and closes below its neutral level of 50, it would indicate a rise in selling pressure and a further fall in Ripple’s price.
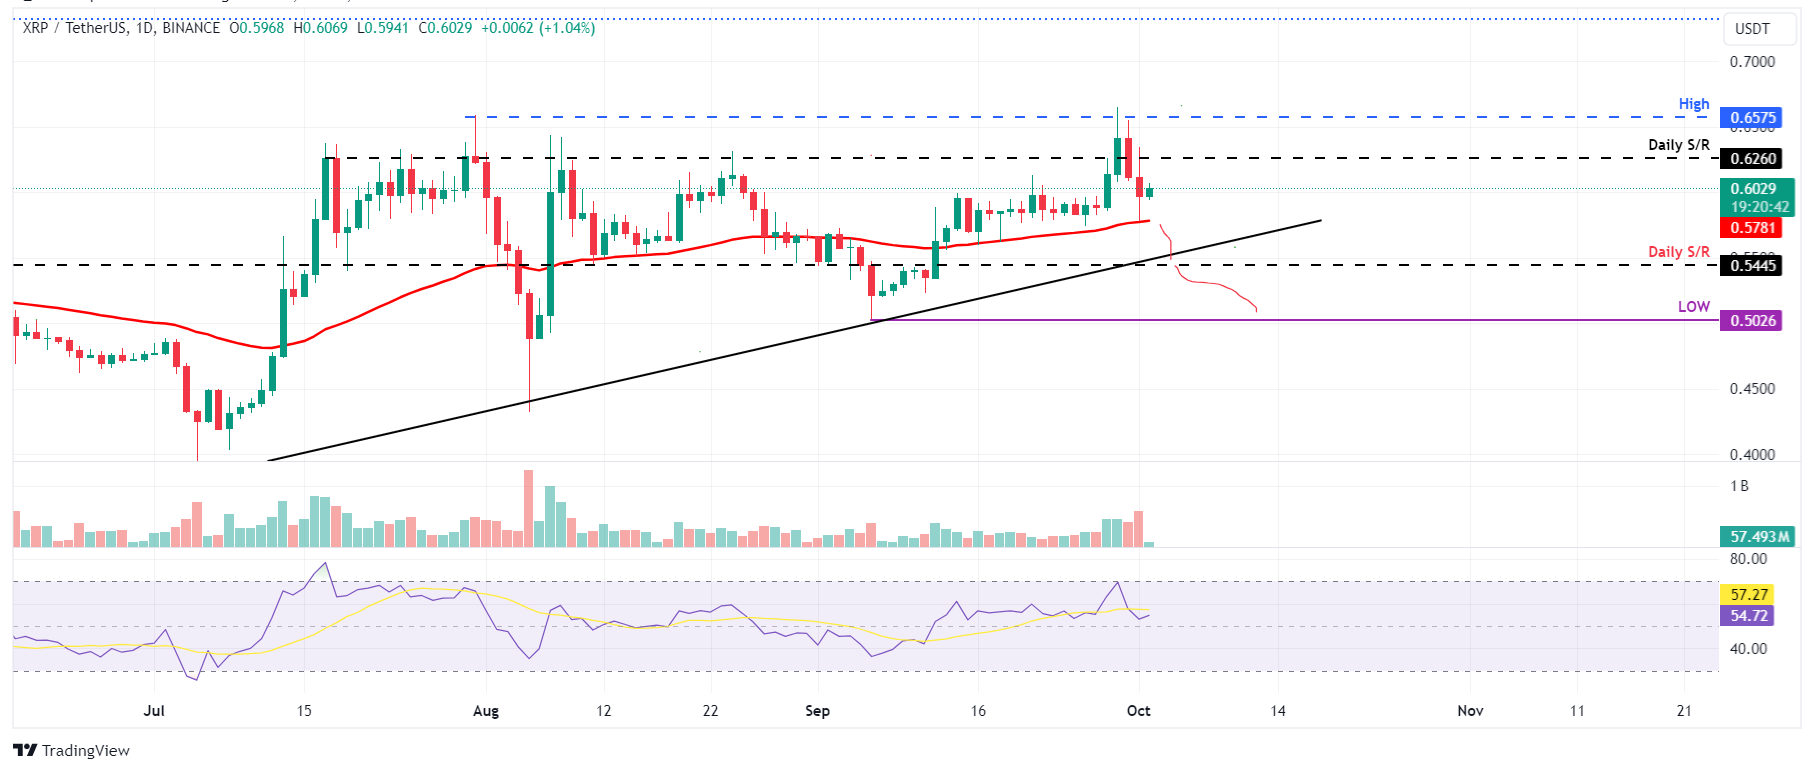
XRP/USDT daily chart
However, if XRP rises and closes above the $0.626 resistance level, it could extend its rise to retest its July 31 high of $0.657.
Bitcoin, altcoins, stablecoins FAQs
Bitcoin is the largest cryptocurrency by market capitalization, a virtual currency designed to serve as money. This form of payment cannot be controlled by any one person, group, or entity, which eliminates the need for third-party participation during financial transactions.
Altcoins are any cryptocurrency apart from Bitcoin, but some also regard Ethereum as a non-altcoin because it is from these two cryptocurrencies that forking happens. If this is true, then Litecoin is the first altcoin, forked from the Bitcoin protocol and, therefore, an “improved” version of it.
Stablecoins are cryptocurrencies designed to have a stable price, with their value backed by a reserve of the asset it represents. To achieve this, the value of any one stablecoin is pegged to a commodity or financial instrument, such as the US Dollar (USD), with its supply regulated by an algorithm or demand. The main goal of stablecoins is to provide an on/off-ramp for investors willing to trade and invest in cryptocurrencies. Stablecoins also allow investors to store value since cryptocurrencies, in general, are subject to volatility.
Bitcoin dominance is the ratio of Bitcoin's market capitalization to the total market capitalization of all cryptocurrencies combined. It provides a clear picture of Bitcoin’s interest among investors. A high BTC dominance typically happens before and during a bull run, in which investors resort to investing in relatively stable and high market capitalization cryptocurrency like Bitcoin. A drop in BTC dominance usually means that investors are moving their capital and/or profits to altcoins in a quest for higher returns, which usually triggers an explosion of altcoin rallies.
Author

Manish Chhetri
FXStreet
Manish Chhetri is a crypto specialist with over four years of experience in the cryptocurrency industry.


