Bitcoin edges up after Iran attack on Israel fuels sharp sell-off
- Bitcoin price falls below its key support level of $62,000 after Tuesday’s sharp sell-off, which was driven by Iran’s attack on Israel.
- US spot ETFs recorded outflows of $240.60 million on Tuesday, the largest single-day drop since September 3.
- CryptoQuant’s weekly report suggests Bitcoin could rise in the coming days, but demand must increase.

Bitcoin (BTC) recovers slightly on Wednesday, trading above $61,000, after Tuesday’s slump due to the escalating Israel-Iran conflicts. The decline, which led BTC to trade below $61,000, wiped out more than $500 million from the crypto market. US spot ETF data recorded outflows of over $240 million, the largest single-day decline in almost one month, signaling a decline in institutional demand.
Bitcoin dips amid escalating tensions between Iran and Israel
Global equities and risk assets like Bitcoin experienced a setback on Tuesday as Iran launched missiles at Israel, giving rise to Fear, Uncertainty and Doubt (FUD) in the markets as Israel might respond to this attack in the coming days. This missile strike was the response to Israel’s series of attacks on Lebanon in the past weeks.
Due to this event, Bitcoin and the US S&P 500 index fell 3.98% and 0.84%, respectively,as investors flew towards safe-haven assets like Gold, which rose more than 1% on the day.
Bitcoin’s price drop triggered a wave of liquidations across the crypto market, resulting in over $500 million in total liquidations and more than $140 million specifically in BTC, according to data from CoinGlass.
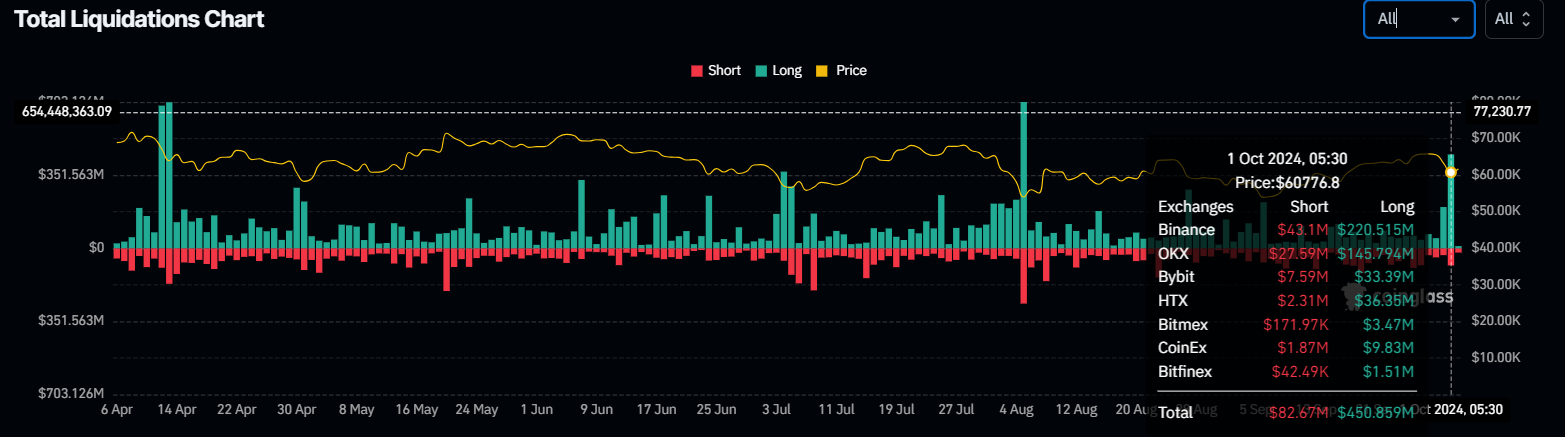
Total Liquidations chart
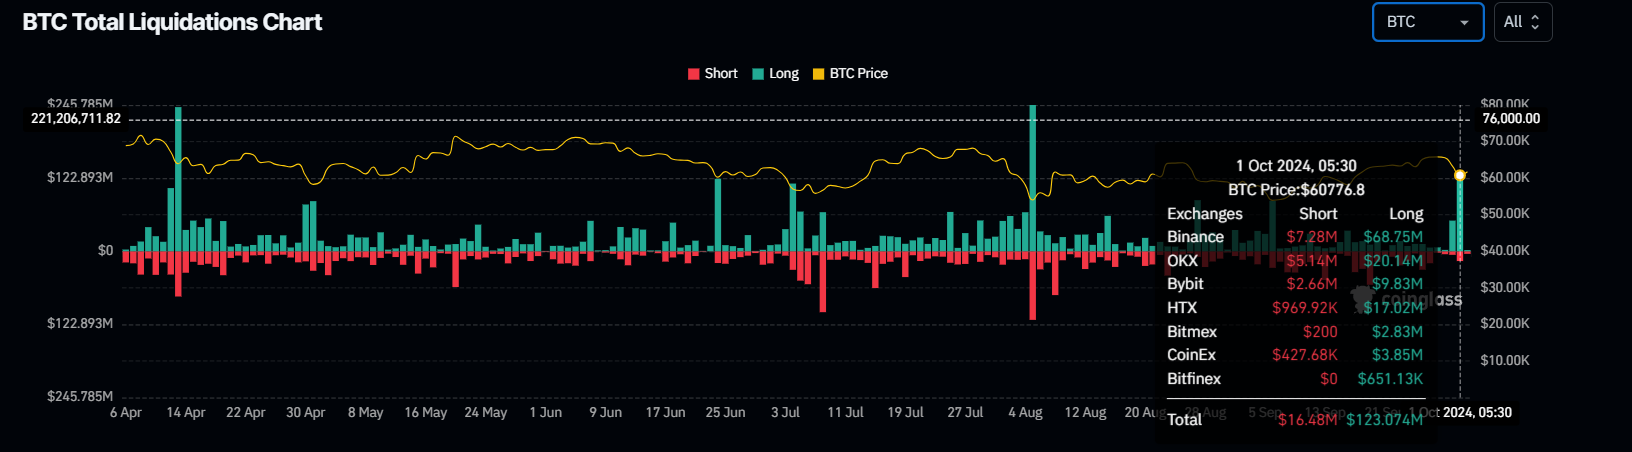
Bitcoin Liquidation chart
US Bitcoin Spot Exchange Traded Funds (ETF) data recorded an outflow of $240.60 million on Tuesday, the largest single-day drop since September 3, and ending a streak of eight days of inflows . Studying the ETF flow data can be useful for observing institutional investors’ sentiment for Bitcoin. If this magnitude of outflows persists, demand for Bitcoin will decrease, leading to a decline in its price.
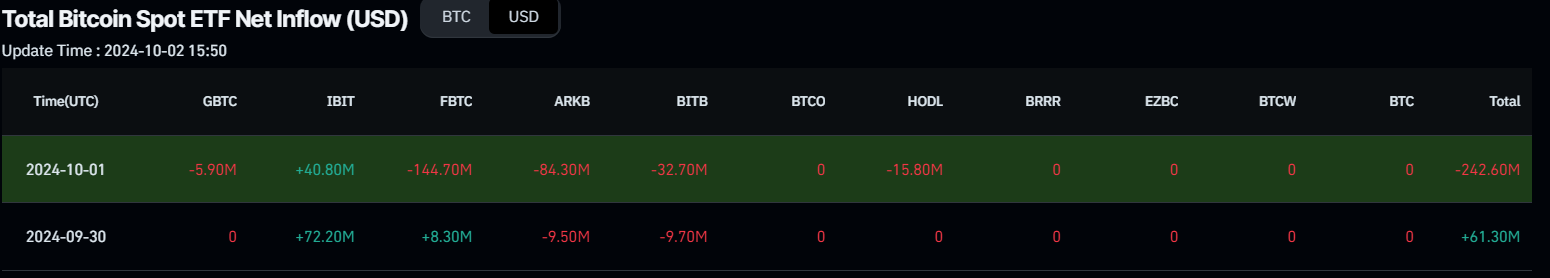
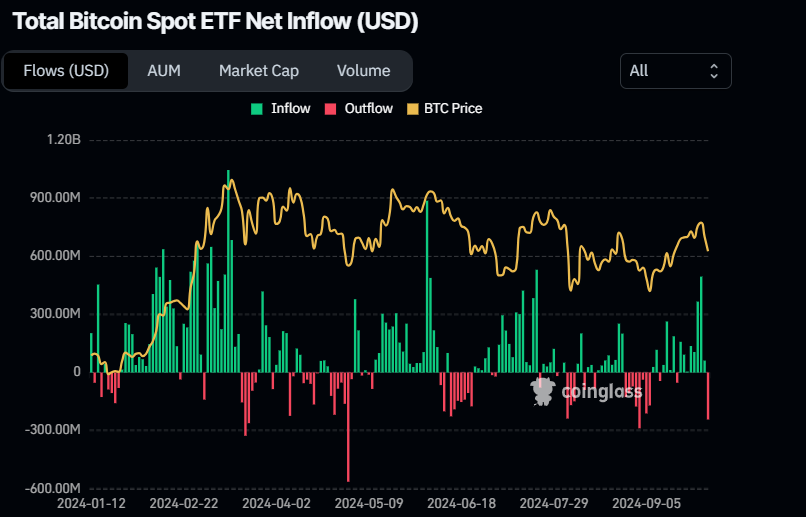
Bitcoin Spot ETF Net Inflow chart
CryptoQuant sees Bitcoin price up to $85K-$100K if demand increases
CryptoQuant’s weekly report highlights that Bitcoin might rise in the coming days, but demand still needs to pick up.
“Bitcoin is entering into a period of positive seasonal performance,” the report says, attributing it to the fact that BTC generally has performed well in the fourth quarter when in a bull cycle, particularly in a halving year like 2024.
The graph below shows that in previous Bitcoin halving years (2012, 2016 and 2020), the price of BTC increased by 9%, 59% and 171%, respectively. Bitcoin’s price performance in 2024 was similar to that of 2016 and 2020 up to September.
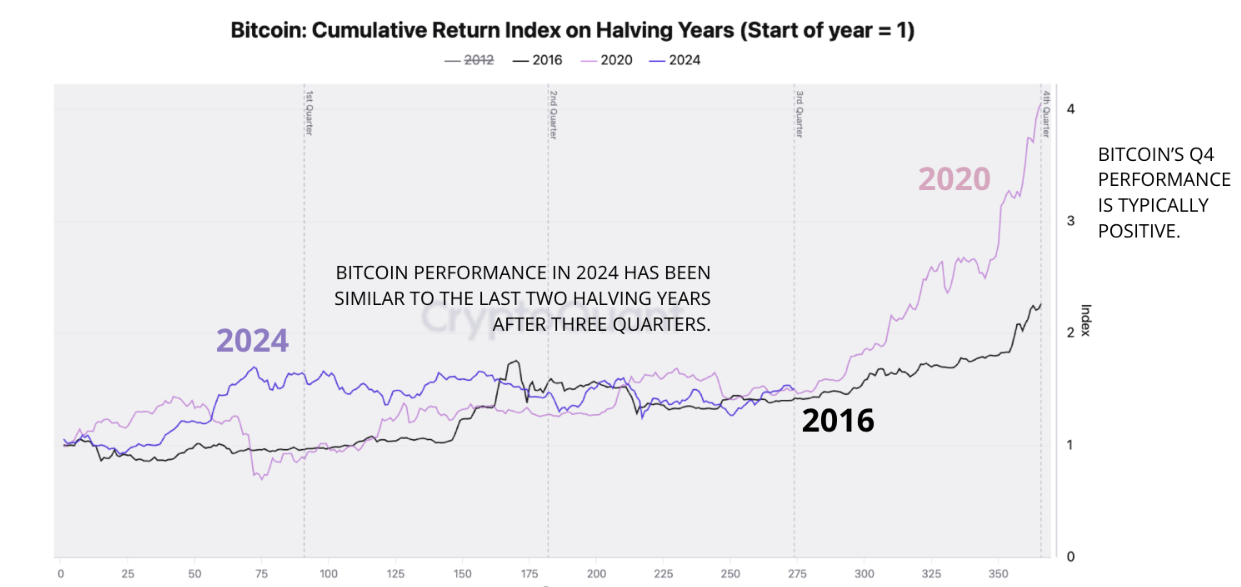
Bitcoin Cumulative Return Index chart
The report also highlights that Bitcoin’s apparent demand seems to have stopped falling, although it needs to grow faster to sustain higher prices in Q4.
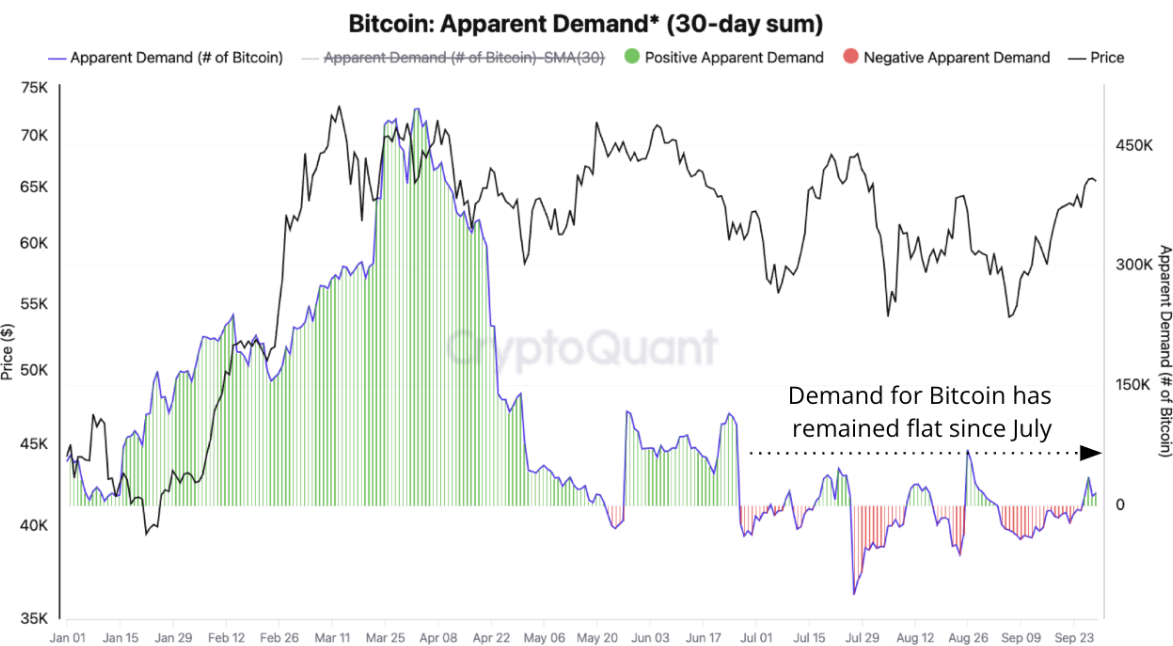
Bitcoin Apparent Demand chart
Institutional demand via Exchange Traded Funds (ETFs) in the US is key for further price rises, CryptoQuant analysts say, noting that inflows have started to pick up again.
If ETF demand continues to accelerate, it can propel prices up in the last quarter of 2024, the analysts say, projecting that Bitcoin could target $85,000 to $100,000 in Q4.
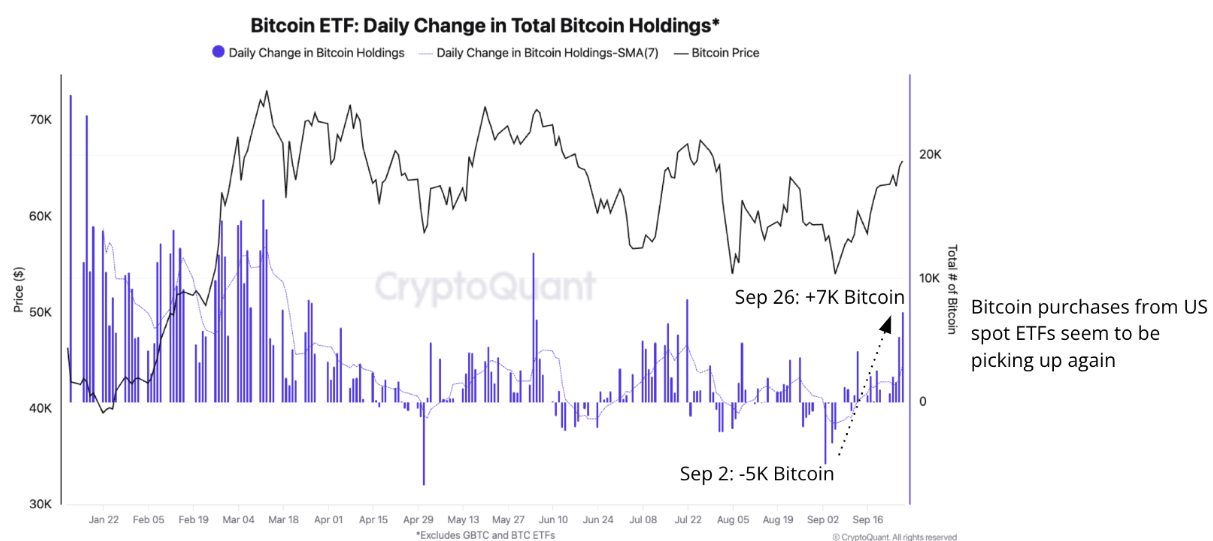
Bitcoin ETF chart
The graph below explains that the levels represent the upper and maximum levels of the trader’s on-chain realized price bands, quantifying the price levels at which short-term Bitcoin traders typically start to take profits after a price rally.
Historically, the upper band (dotted orange line) has been a price resistance during this bull run and currently stands around $86,000. The max band, which currently stands around $106,000 (dashed red line), was the ultimate price resistance in March when Bitcoin reached its most recent all-time high of $73,600.
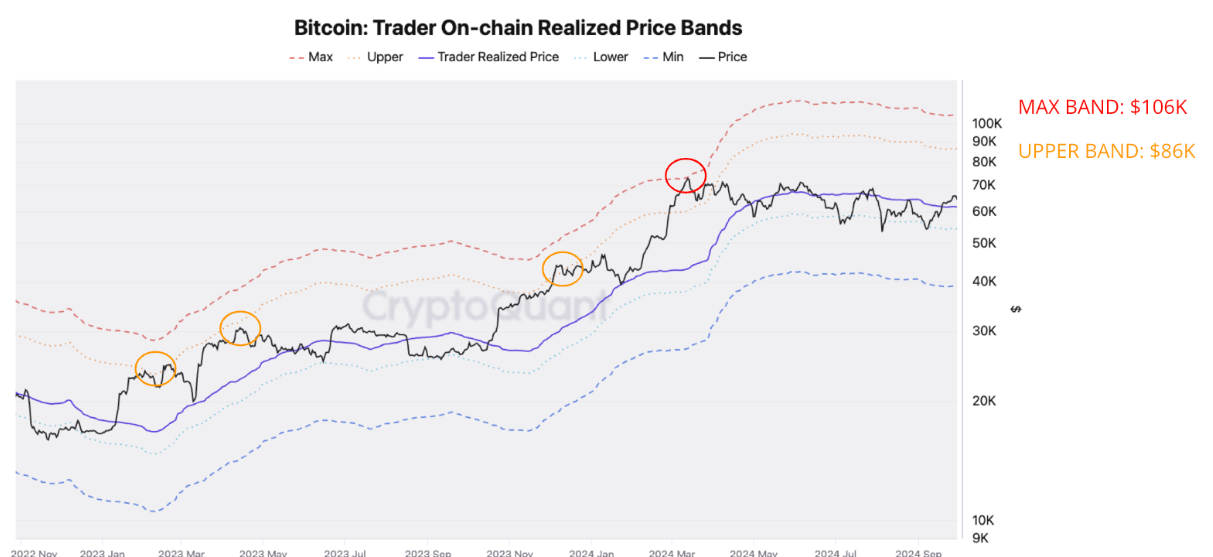
Bitcoin traders realized price bands chart
Technical analysis: BTC shows signs of weakness
Bitcoin price was rejected from its psychologically important $66,000 level on Saturday and declined more than 7% over the next three days, closing below its support level of $62,000. As of Wednesday, it is recovering slightly, trading around $61,000 but getting rejected around $62,000.
If the $62,000 level holds as resistance and BTC closes below its 200-day Exponential Moving Average (EMA) at $59,895, it could extend its decline to retest its September 17 low of $57,610.
The Moving Average Convergence Divergence (MACD) indicator further supports Bitcoin’s fall, signaling a bearish crossover on Tuesday. The MACD line (blue line) has moved below the signal line (yellow line), giving a sell signal. It also shows red histogram bars below the neutral line zero, suggesting that Bitcoin’s price could experience downward momentum.
Additionally, the Relative Strength Index on the daily chart has fallen sharply to 47, below its neutral level of 50. A cross to levels below the neutral level generally indicates bearish momentum is gaining traction.
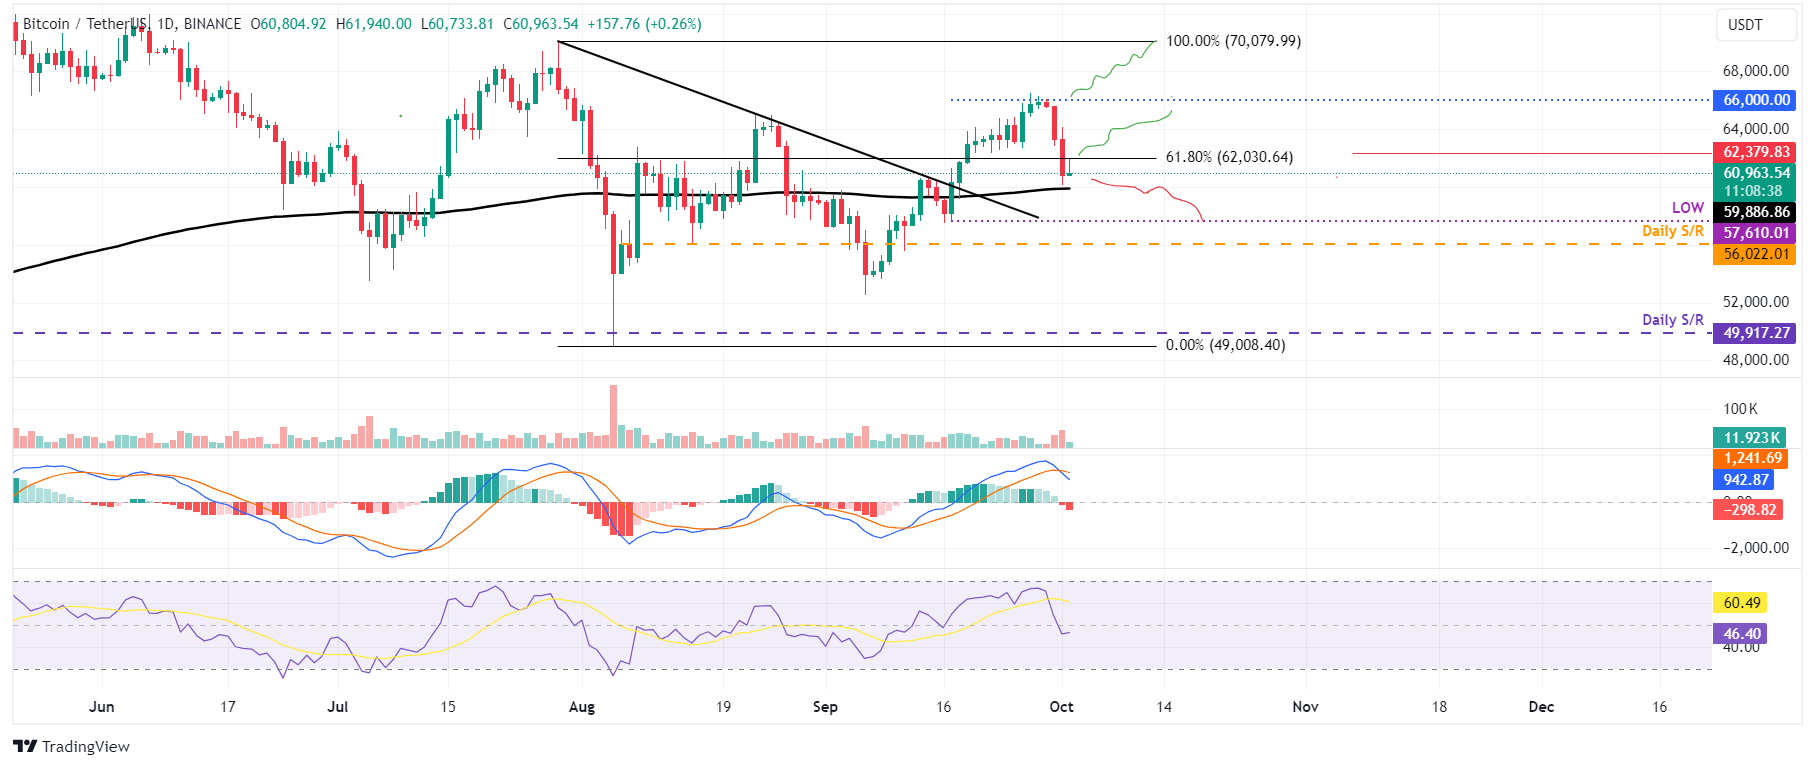
BTC/USDT daily chart
However, if BTC rises, closing above the $62,000 level, it could resume the rally to retest its next resistance at $66,000.
Bitcoin, altcoins, stablecoins FAQs
Bitcoin is the largest cryptocurrency by market capitalization, a virtual currency designed to serve as money. This form of payment cannot be controlled by any one person, group, or entity, which eliminates the need for third-party participation during financial transactions.
Altcoins are any cryptocurrency apart from Bitcoin, but some also regard Ethereum as a non-altcoin because it is from these two cryptocurrencies that forking happens. If this is true, then Litecoin is the first altcoin, forked from the Bitcoin protocol and, therefore, an “improved” version of it.
Stablecoins are cryptocurrencies designed to have a stable price, with their value backed by a reserve of the asset it represents. To achieve this, the value of any one stablecoin is pegged to a commodity or financial instrument, such as the US Dollar (USD), with its supply regulated by an algorithm or demand. The main goal of stablecoins is to provide an on/off-ramp for investors willing to trade and invest in cryptocurrencies. Stablecoins also allow investors to store value since cryptocurrencies, in general, are subject to volatility.
Bitcoin dominance is the ratio of Bitcoin's market capitalization to the total market capitalization of all cryptocurrencies combined. It provides a clear picture of Bitcoin’s interest among investors. A high BTC dominance typically happens before and during a bull run, in which investors resort to investing in relatively stable and high market capitalization cryptocurrency like Bitcoin. A drop in BTC dominance usually means that investors are moving their capital and/or profits to altcoins in a quest for higher returns, which usually triggers an explosion of altcoin rallies.
Author

Manish Chhetri
FXStreet
Manish Chhetri is a crypto specialist with over four years of experience in the cryptocurrency industry.