Will stocks be Brady or Mahomes?
One week, Reddit bandits take on hedge funds and win, pumping up stocks like GameStop and AMC while the broader market sees its worst decline since October.
What a difference a week can make.
The indices then see their most significant gains the next week since Joe Biden's election victory and don't see a down day all week.
Now we're here- still amid a tug of war between sentiments. For now, though, things are looking rosy. That is, of course, unless you're Patrick Mahomes this morning.
Can the market keep up it's winning streak this week? It's possible. But I'd be surprised if we don't see at least one sharp pullback before this Friday (Feb. 12).
Can the market keep up its winning streak this week? It's possible. But I'd be surprised if we don't see at least one sharp pullback this week.
Despite tailwinds moving the markets right now, such as stimulus progress, an ever-improving vaccine delivery, the possibility of an effective one-dose vaccine from Johnson and Johnson (JNJ), falling COVID numbers, and an improving economic outlook based on consistently falling jobless claims and corporate earnings that continue to crush, I want you to be wary of complacency and overvaluation.
Yes, I know I keep saying this. I also know that earnings are on pace to rise by over 20% in 2021. Since 1980, only 12 years have earnings increased by 15% or more. Except for 2018, the market gained an average of 12% in all of those years.
But consider some valuation metrics that scream "bubble."
As of February 4, 2021, the Buffett Indicator , or the ratio of the total US stock market valuation to the GDP, was at a level not seen since the dotcom bubble. If you take the US stock market cap of $48.7 trillion and the estimated GDP of $21.7 trillion, we're nearly 224% overvalued and 84% above the historical average.
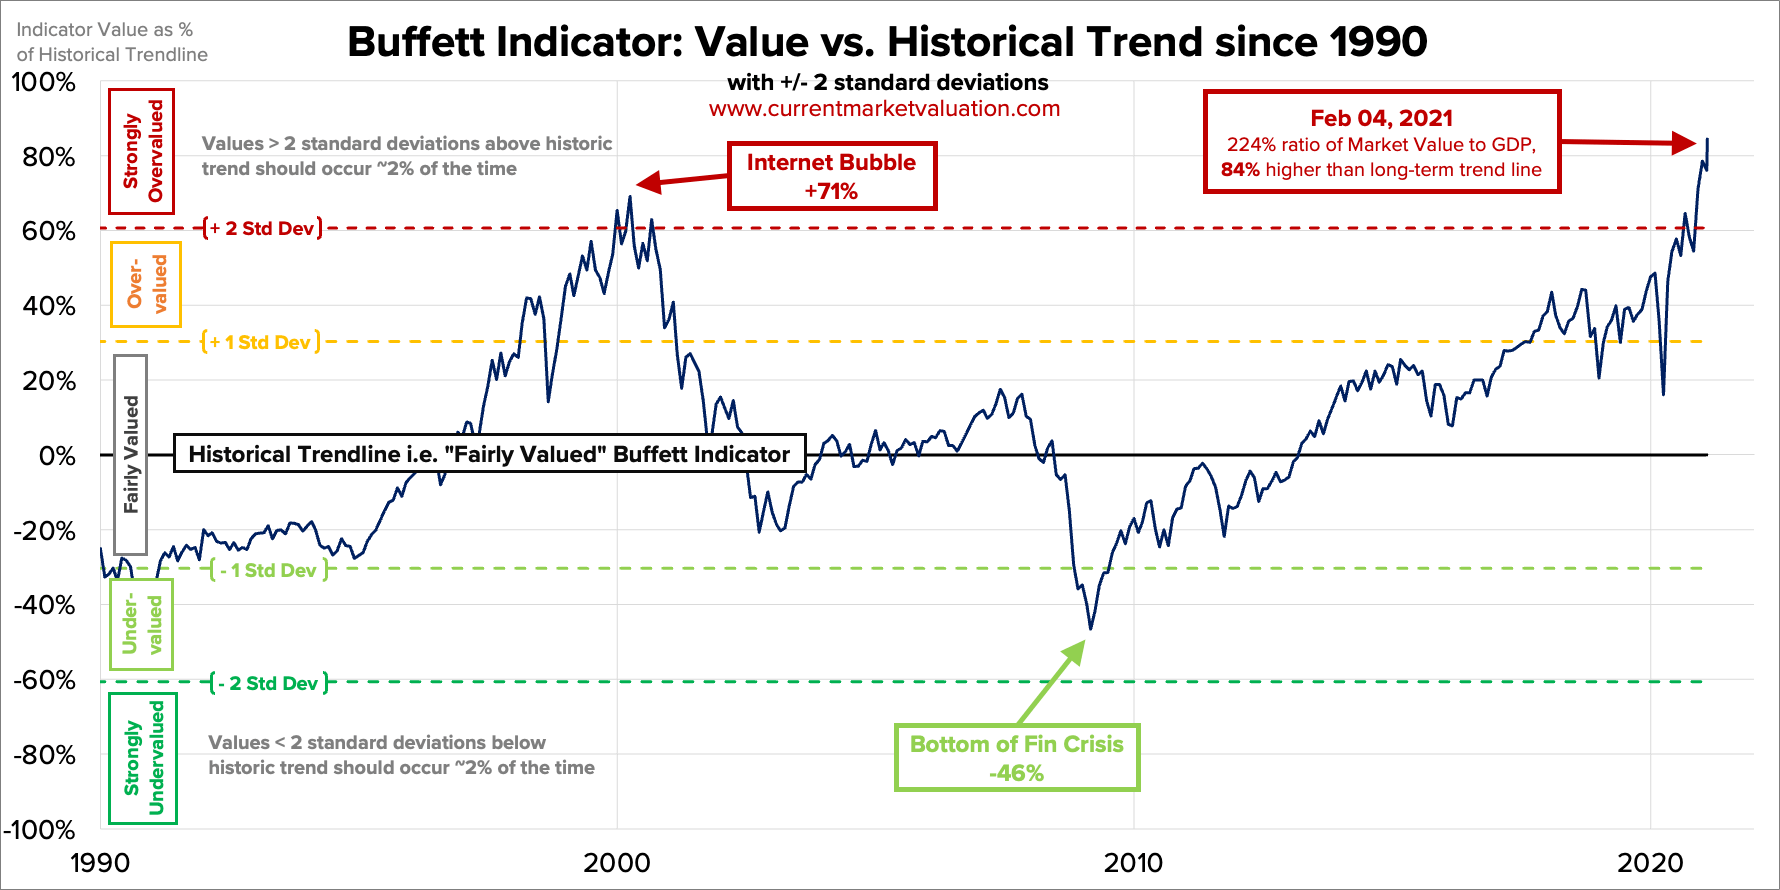
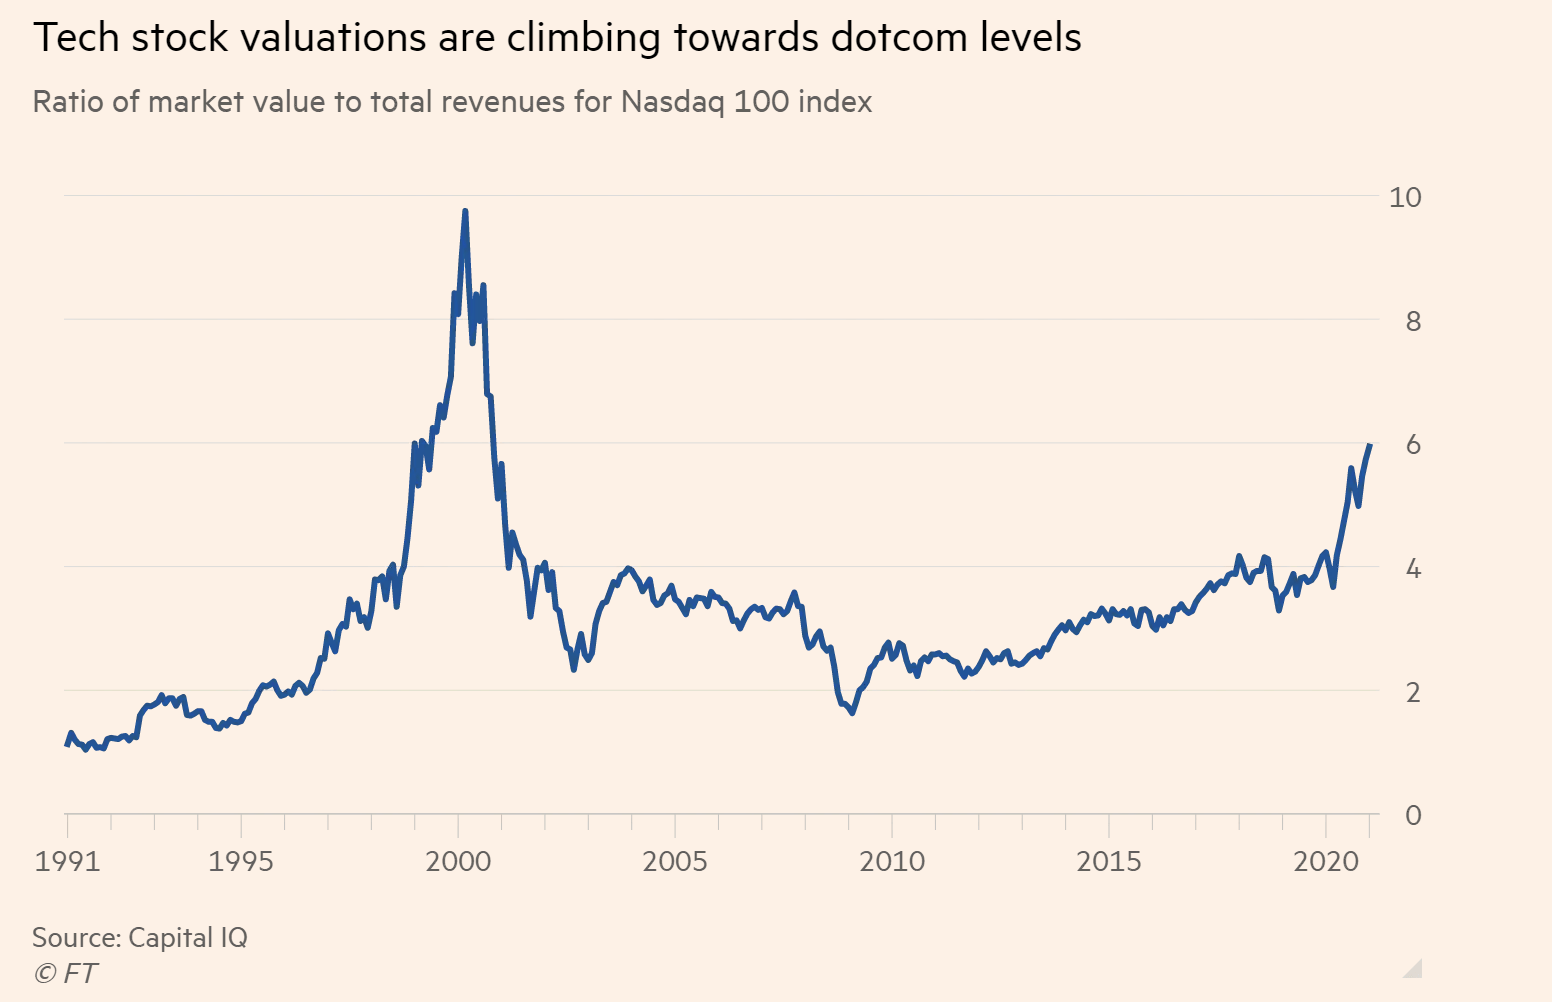
With the S&P 500, Nasdaq, and Russell 2000 all currently trading at record closes, fears of a bubble are genuine. The S&P 500's forward 12-month P/E ratio is back to above 22 and well above the 10-year average of 15.8. The Russell 2000 is also back at a historic high above its 200-day moving average. Tech stock valuations are also approaching dot- com bust levels.
Yes, the outlook is healthy and for good reason. According to a recent Bank of America survey of 194 money managers, bullishness on stocks is at a three-year high, and the average share of cash in portfolios, a sign of protection from market turmoil, is at its lowest level since May 2013.
But always remember that when the market gets what it expects, and we're expecting strength by mid-year, it's usually a time to sell rather than buy.
While I don't foresee a crash like we saw last March, I still maintain that some correction before the end of Q1 could happen.
Corrections are healthy and normal market behavior, and we are long overdue for one. They are also way more common than most realize. Only twice in the last 38 years have we had years WITHOUT a correction (1995 and 2017).
A correction could also be an excellent buying opportunity for what could be a great second half of the year.
My goal for these updates is to educate you, give you ideas, and help you manage money like I did when I was pressing the buy and sell buttons for $600+ million in assets. I left that career to pursue one where I could help people who needed help, instead of the ultra-high net worth.
With that said, to sum it up:
While there is long-term optimism, there are short-term concerns. A short-term correction between now and the end of Q1 2021 is possible. I don't think that a decline above ~20%, leading to a bear market will happen.
Hopefully, you find my insights enlightening. I welcome your thoughts and questions and wish you the best of luck.
How Frothy is Tech Again?

Figure 1- Nasdaq Composite Index $COMP
I remain bullish on tech. Its earnings continue to defy expectations with stocks like Amazon, Alphabet, PayPal, and eBay all crushing estimates last week. I'm also especially bullish on subsectors such as cloud computing, e-commerce, and fintech for 2021.
But please monitor the RSI.
The Nasdaq is opening the week at another record high and is continuing to show strength. But there are clear echoes of the dotcom bubble 20-years ago, and the index has been trading in an RSI-based pattern.
Let's break down the Nasdaq since December and how it has reacted whenever the RSI has exceeded 70.
December 9- exceeded an RSI of 70 and briefly pulled back.
January 4- exceeded a 70 RSI just before the new year, and declined 1.47%.
January 11- declined by 1.45% after exceeding a 70 RSI.
Week of January 25- Exceeded an RSI of over 73 before the week, and declined 4.13% for the week.
Every single time the RSI exceeded 70, I switched my Nasdaq call to a SELL.
Why?
The Nasdaq is trading in a precise pattern.
The RSI is at around 67.50 so I'm not ready to switch my call again. But I am a bit concerned. Tech valuations, especially the tech IPO market, terrify me. SPACs don't help either.
The ratio of market value to total revenues has also not been this high since the dotcom bust.
I still like tech and am bullish for 2021. But for now, I'm going to stay conservative and say HOLD while monitoring the RSI.
For an ETF that attempts to directly correlate with the performance of the NASDAQ, the Invesco QQQ ETF (QQQ) is a good option.
Want free follow-ups to the above article and details not available to 99%+ investors? Sign up to our free newsletter today!
Want free follow-ups to the above article and details not available to 99%+ investors? Sign up to our free newsletter today!
Author

Matthew Levy, CFA
Sunshine Profits
After graduating with a Bachelor of Science in Economics from the University of Victoria in 2010, Matthew developed a passion for helping clients meet their financial freedom through strong, risk-adjusted portfolios.


