Weekly waves: EUR/USD, Bitcoin, and Dow Jones
-
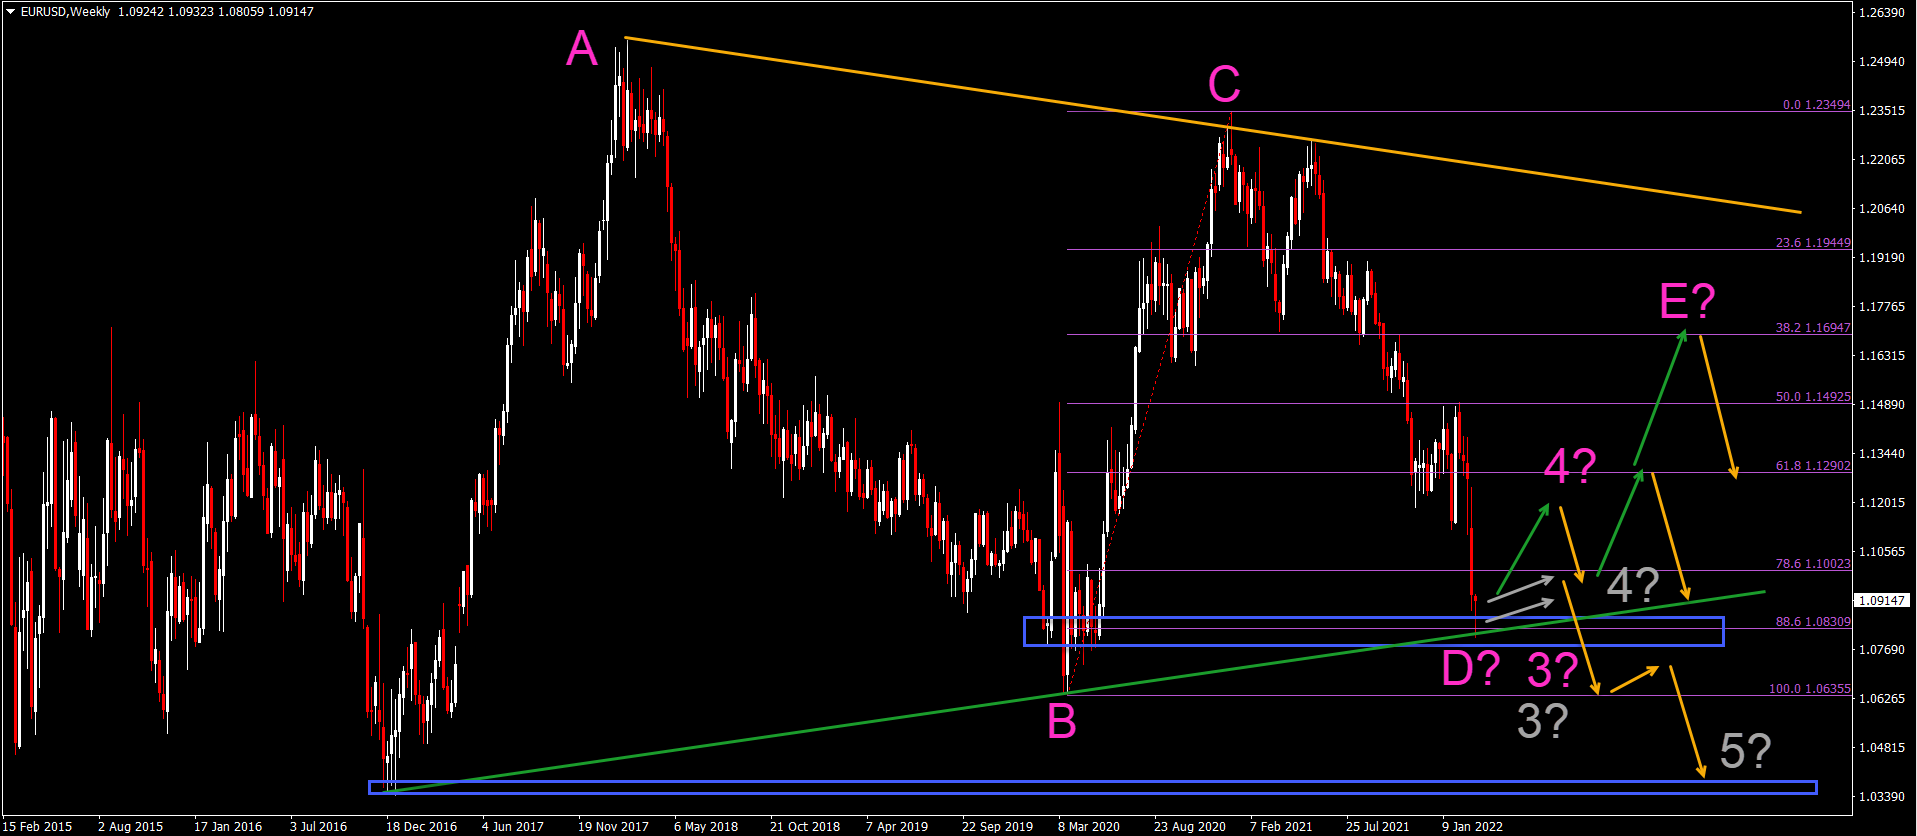
EUR/USD is in a free fall after dropping 700 pips from 1.15 to 1.08 in just 4 weeks. The EUR/USD has managed to reach the 88.6% Fibonacci retracement support.
-
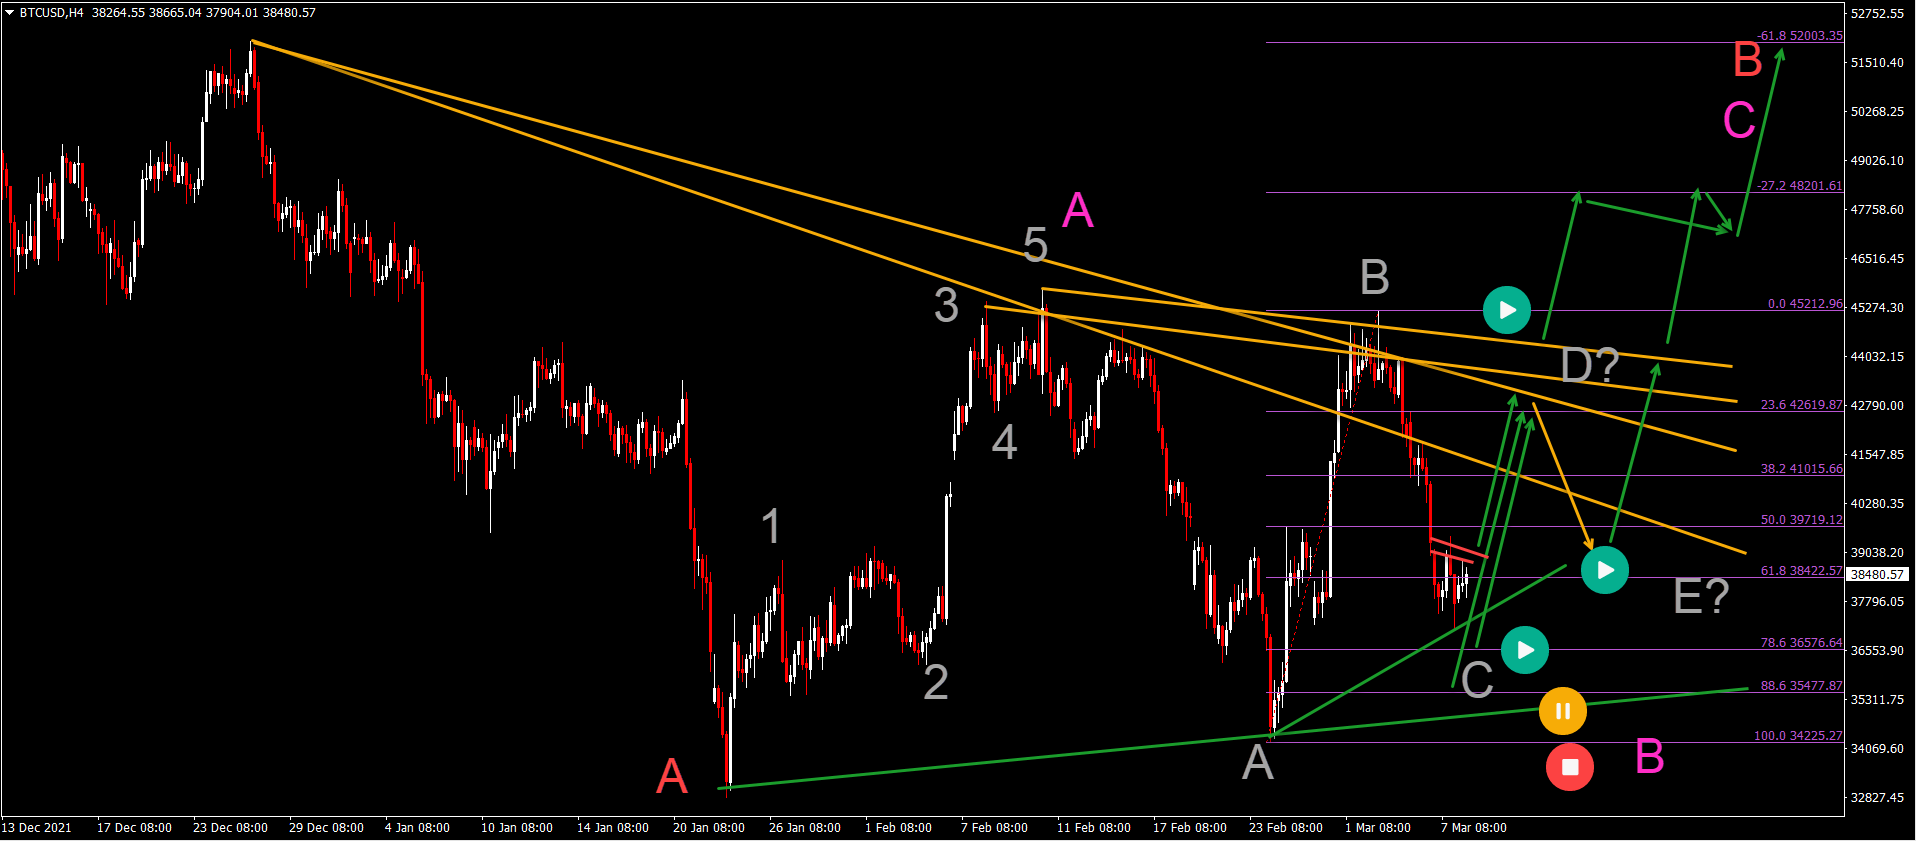
The Bitcoin crypto pair (BTC/USD) made a huge bullish bounce up but price action was unable to break above the resistance (orange).
-
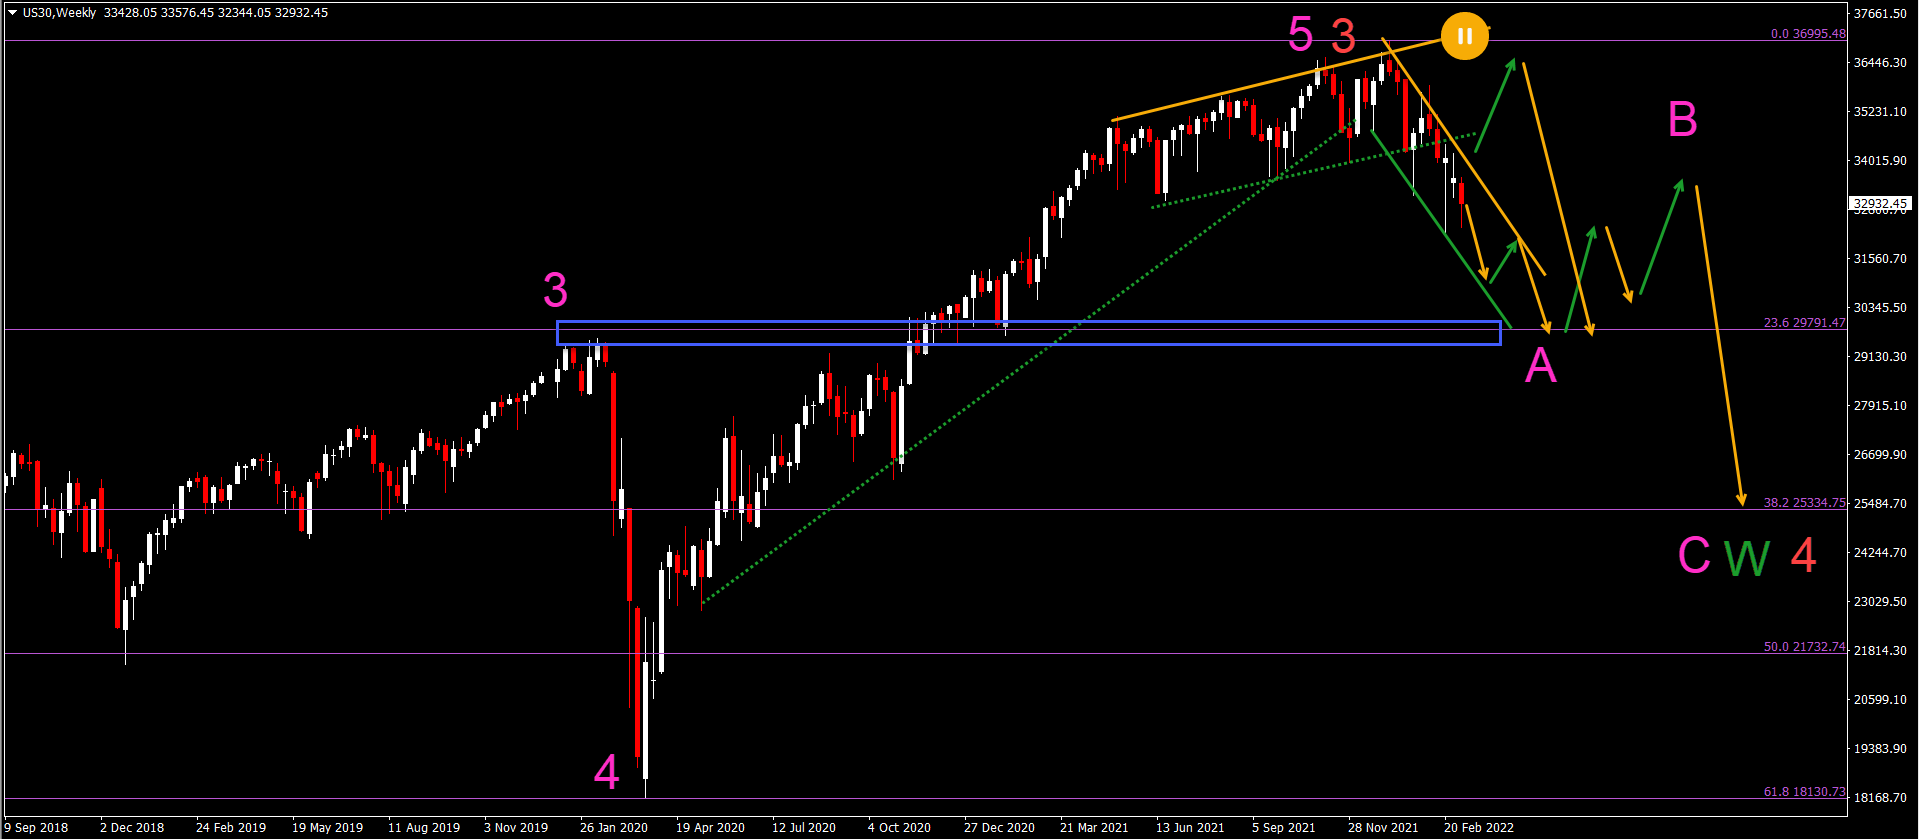
The US30 weekly chart seems to be building a bearish retracement or reversal after being in a long-term uptrend.

EUR/USD
-
The EUR/USD has managed to reach the 88.6% Fibonacci retracement support level at 1.08.
-
The support zone (blue box and green line) could cause the EUR/USD to pauze its downtrend.
-
If price action builds a bear flag pattern (gray lines), then a downtrend continuation is expected. In that case, price action is probably building a wave 3 (pink or gray). A shallow retracement indicates a wave 3 (gray) of wave 3 (pink) but a deeper retrace could indicate a wave 4 (pink) instead.
-
If price action is more bullish (green arrow), then a larger bullish retracement is expected to take place. In that case, a wave D-E (pink) pattern is expected.
-
An immediate break below the support zone could indicate an immediate downtrend.
BTC/USD
-
BTC/USD has probably made a wave B (gray) at the lower high.
-
This wave B (gray) seems to be part of a larger ABC (gray) pattern within a wave B (pink).
-
A deeper bearish retracement could take place if price action stays below the local resistance zone (red lines).
-
But the Fibonacci levels are expecting to be a support zone if price action indeed completed a wave A (pink) impulse.
-
A bullish price swing could test the resistance trend lines (orange). A bearish bounce indicates the potential for an ABCDE triangle (gray).
-
A bullish breakout is part of a wave C (pink) in wave B (red).
US 30
The US30 is in a downtrend channel after breaking below the support zone (dotted green lines):
-
The US30 weekly chart seems to be building a bearish retracement or reversal after being in a long-term uptrend.
-
The wave 5 (pink) of wave 3 (red), however, seems completed and price action is retracing within a potential wave 4 (red).
-
The retracement could go as far as the 23.6% Fibonacci level which could provide a bounce back up.
-
An ABC (pink) pattern could take price action back as low as the 38.2% Fibonacci retracement level.
-
The ABC (pink) pattern could be part of a complex wave W (green).
-
The analysis has been done with the indicators and template from the SWAT method simple wave analysis and trading. For more daily technical and wave analysis and updates, sign-up to our newsletter
Author

Chris Svorcik
FS method
Chris Svorcik is a trader, analyst, and educator with over 15 years of experience in financial markets, specializing in moving averages, market structure, and price patterns.


