USDJPY Forecast 2017: Kuroda will need to work alongside with Trump

Central Bankers' battle against low inflation has reached a new milestone in Japan, as the BOJ introduced last September QQE, with yield curve control, in a last-ditch effort to boost the local economy. Basically, that means that they would adjust the volume of its asset purchases as necessary in the short term to control bond yields, entailing to keep the 10-year government bond yield at zero, while keeping it at about ¥80 trillion annually over the long term. The Bank, adopted negative rates late January, with the current benchmark at -0.10%.
Back in September the USD/JPY pair was struggling with the ¥100.00 level, after starting the year around ¥120.00. Japan is an export-heavy economy, and an expensive JPY was surely not helping to boost the economy. But yen's strength was unstoppable back then, and the market got used to the daily jawboning from BOJ's officers, saying that they were "closely watching" unidirectional moves that anyway, had no effects on the exchange rate. Funny, we heard nothing on them over the past month, in spite of the pair rallying around 800 pips pretty much straight, compliments to the US election and the FED.
Japan got a helping hand from the US, as perspectives of upcoming Trump's policies boosting growth and inflation, alongside with the three rate hike foresee by the US Federal Reserve, fueled dollar's demand, putting the pair just 200 pips away from the 120.00 threshold. The main reason behind this sharp depreciation of the JPY is that US yields have soared to their highest in nearly two years after US election prompted demand for USD-nominated assets, with the 10-year Treasury yield up to 2.50%, while JGB's one stands pat close to zero, as per BOJ's policy.
And in spite of BOJ's policies not working, the Central Bank has the chance to breath next 2017, although it will depend mostly on Mr. Trump and his promises of boosting US growth. The BOJ, however, will probably need to maintain monetary easing all through 2017, to reach its target of keeping inflation stable above 2%.
Economic activity in Japan has shown signs of picking up during this last quarter of the year, although poor wage growth still are a drag. After six years of Abenomics, wages have grown by a measly 2.1%, resulting in poor household spending all through these years. So, low wages keep consumer spending weak, which at the end means inflation will remain subdued. The Japanese government has adopted a plan to improve the conditions of workers with temporary contracts and low wages this December, but the effects are still to be seen.
USDJPY Technical outlook
-636180800407090694.png)
These last three-month rally has put the USD/JPY pair back into bullish territory, moreover when one looks at the monthly chart, which showed that it bottomed this year around the 50% retracement of the 2011/15 rally. Now trading above the 23.6% retracement, located at 114.00, the level is a line in the sand for the ongoing bullish trend, and to keep the long-term bullish trend alive, the level has to hold on pullbacks. The mentioned chart shows an interesting recovery in technical indicators from oversold territory, but also shows that the upward momentum is fading, probably due to winter holiday's decreased volume, rather than lack of buying interest.
Should the FED remain confident during the upcoming meetings, 120.00 is the next probable target, en route to 125.80/126.00, a region that has contained the upside multiple times since May 2002. At this point, a break above seems to be hidden in the mist, as it will take a lot of social and political work in Japan, alongside with US expected growth, to push it beyond it next year.
If sentiment deteriorates enough to push the pair back below 114.00, the pair can fall down to the 110.00/111.00 region, also a strong long-term support as the price stalled around it several times over this 2016. A turn to the worse in the US economy will probably push the pair below it, with 106.60, the 38.2% retracement of the Abenomics rally as the next bearish target.
USDJPY Point & Figure Chart

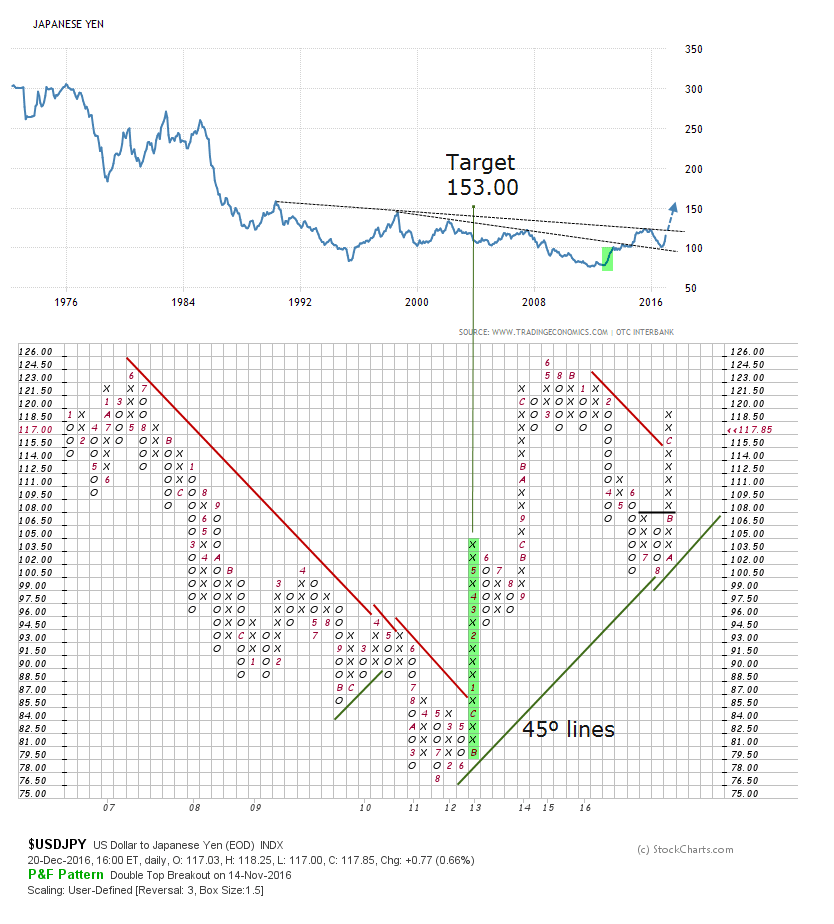
That appreciation in the US dollar versus the Japanese yen entered consolidation phase around the 100.00 figure before resolving higher with a break of a historical trend line and challenge a second resistance in the 125.00 highs.
The case for additional upward progress then is fairly good because the congestion pattern which has formed again around the 100.00 figure this year is capable of higher counts. But we prefer to stay conservative and use the same count we had in the previous Forecast 2016 edition: the 153.00 yen for 1 US dollar. Once this aforementioned line is broken there is plenty of room to accommodate this projection.
Author

Valeria Bednarik
FXStreet
Valeria Bednarik was born and lives in Buenos Aires, Argentina. Her passion for math and numbers pushed her into studying economics in her younger years.


