USD/JPY Forecast: Another higher low on the weekly 50-MA likely

The Dollar-Yen pair fell to a low of 110.55 on Friday on heightened geopolitical tensions in the Korean peninsula and extended losses to a low of 110.31 this Monday morning in Asia. The currency dipped below the weekly 50-MA of 110.43 before trimming losses to trade around 110.55 levels.
Higher lows on the weekly 50-MA
-636370714347107676.png)
The previous two higher lows - 108.13 (Apr low) and 108.80 (June low) were on the weekly 50-MA, which bottomed out in Q3 2016-Q1 2017 and is now sloping upwards.
The spot could leave another higher low on the weekly 50-MA this week….
Treasury yield curve: US 10yr-2yr spread - higher lows
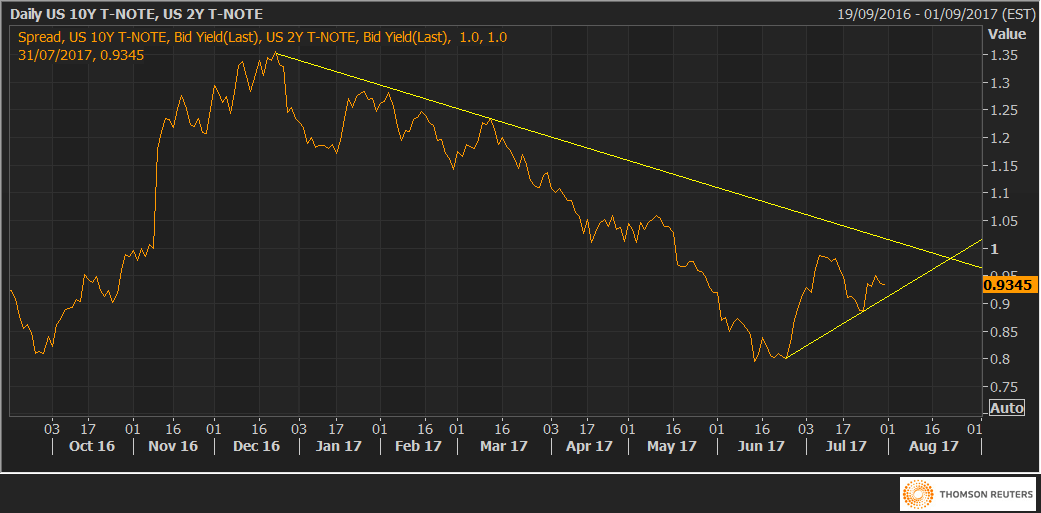
- Despite Friday’s dismal US inflation numbers - core PCE and employment cost index - the yield curve remained unchanged around 94 basis points.
- The chart above shows the higher lows/bottom has remained intact despite weak US data and heightened geopolitical tensions (10-year Treasury yield is most vulnerable to safe haven flows.
US-Japan 10-year yield spread - watch out for a break above 2.3
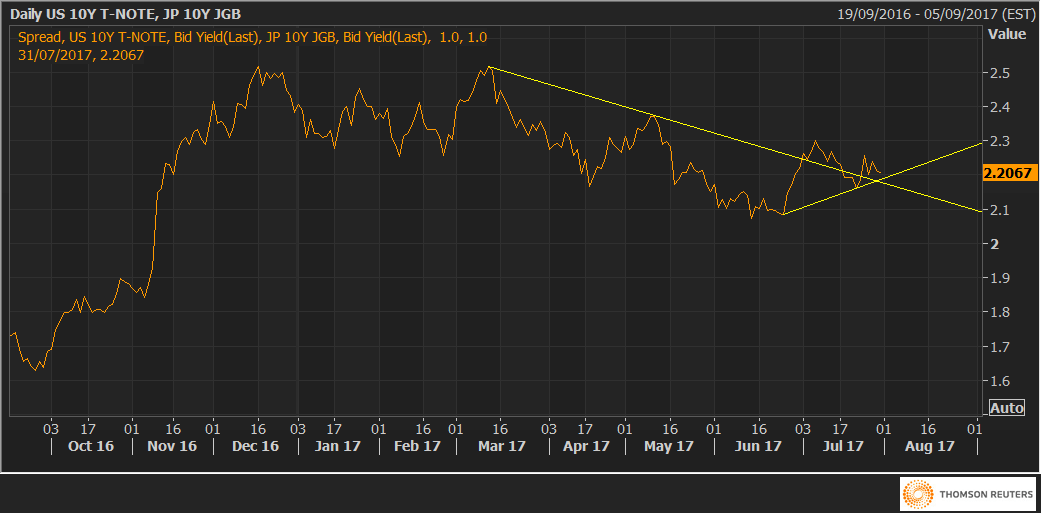
- Breach of the downtrend line, coupled with higher lows formation indicates the spread could break above 2.3 and rise to 2.5 levels. An upside break would be dollar bullish and vice versa.
The Dollar-Yen is more likely to leave a higher low on the weekly 50-MA as the Treasury yield curve looks set to steepen alongside an upside break in the US-Japan 10-year yield spread. (The steepening of the yield curve is dollar positive and vice versa).
Technicals
Resistance
- 110.67 (session high)
- 110.98 (61.8% Fib R of 108.80-114.49)
- 111.11 (5-DMA)
- 111.36 (10-DMA)
Support
- 110.43 (weekly 50-MA)
- 110.00 (psychological level)
- 108.80 (June low)
- 108.13 (May low)
Comments
- An erratic recovery from the Asian session low of 110.31 to 110.55 on the back of a bullish price RSI divergence on the 1-hour chart suggests the sellers may have run out of steam… especially after Friday’s failed attempt to secure an end of the day close below last Monday’s Doji candle low of 110.62.
- A break above 110.67 could yield a rally to 111.11 (5-DMA) and 111.37 (10-DMA). Both the averages are still sloping downwards, thus life for the USD bulls would be difficult above the 10-DMA.
Author

Omkar Godbole
FXStreet Contributor
Omkar Godbole, editor and analyst, joined FXStreet after four years as a research analyst at several Indian brokerage companies.


