USD/CAD Price Forecast 2021: The complications of COVID-19 on the loonie and the hope for a recovery
- Markets in 2021 turn on the defeat of the pandemic and resumption of normal economic activity.
- Comparative statistics did not provide a rationale analysis for the USD/CAD 2020 ascent or decline.
- Pandemic risk premium extraction dominated USD/CAD price trading in 2020 but ended in July at 1.3400.
- Canadian dollar will start 2021 on a strong commodity note, fade as the US economy recovers.

This was the year without ambiguity. From the national economic catastrophes of the lockdowns to the closing of your favorite restaurant, from the US election to the politics of your local school board, COVID-19 touched everyone, destroyed much and left nothing unchanged.
The recovery that is pending under the surface of the pandemic will produce a very different economy than the one that was so vibrant last year. Working from home has come to dominate employment in many fields. Delivery services have replaced shopping for a host of items and the exodus from crowded, expensive and unhealthy urban centers will have dire consequences for New York, London and Paris and all cities that relied on their cultural and social settings to compensate for the cost and inconvenience of concentrated life.
The pandemic is a story that varies in detail and timing from country to country but the outline is the same in all industrial nations. As the pandemic spread from China, its then-unknown quantities prompted the most extreme defensive measures.
In Canada, every provincial government forced its economy into lockdown. In the US the majority of states closed all but essential services for two months. The economic debacle that followed was as predictable as it was novel.
Our purpose is not to argue that a different approach to the pandemic might have produced less damaging results or to speculate on the changes that the pandemic has wrought on the US and Canadian economies.
Our interest is more traditional. We want to know how the timing and shape of the pandemic and the recovery that is coming have affected the relationship between the US and Canadian dollars. Our indicators will be the basics, economic data of the two nations, market information from equities, commodities and oil and the policy response from central banks and government.
USD/CAD analysis: Pandemic collapse in Canada and the US
The superlatives involved in recounting the economic collapse and recovery in the United States and Canada apply to almost every statistic and for brevity we will not mention the recurring records.
For comparison will be Canadian and US GDP, Unemployment Rates, Net Change in Employment and Nonfarm Payrolls, Ivey Purchasing Managers' Index (PMI) and the Institute for Supply Management (ISM) PMI, and Retail Sales. Again, for concision we will not define the statistics.
The comparison is two-fold. Did the rebound cover the March and April decline? Have the subsequent months resumed a normal progression? The pertinent question: Is there a data set that explains the decline of the USD/CAD over the nine months since the March panic?
Data: Canada and US
In the first six months, the Canadian economy contracted at a 23.1% annualized rate (Q1 -8.2%, Q2 -38.1%). It then recovered at a 40.5% pace in the third quarter, albeit for half the time. American GDP shrank at an annualized rate of 18.2% in quarters one and two (-5%, -31.4%), then expanded at 33.1% in the third quarter. It is currently growing at 11.1% according to the Atlanta Fed.
The Unemployment Rate in Canada topped at 13.7% in May and by November was 8.5%. The US rate peaked at 14.7% in April and was 6.7% in November.
Canada's Net Change in Employment shed 3.00 million jobs in March and April. By November, 2.43M workers, 80.9%, had returned to employment. In the US the numbers are 22.16M job losses, 12.29M returnees, 55.4%.
The Ivey Purchasing Managers' Index plunged from 54.1 in February to 22.8 in April. It returned to 68.5 in July and was down to 52.4 by November. The ISM Services Purchasing Managers' Index was 57.3 in February, 41.8 in April, 58.1 in July and 55.9 in November.
Canadian Retail Sales fell an average of 17.4% in March and April and rose an average of 21.9% in May and June. From July through October the monthly average was 0.63%. For the US, Retail Sales were off 11.5% in March and April and up 13.3% in June and July. The five-month average to November is 0.38%.
Data Comparison: Canadian and US
In the hard data, the Canadian and US economies have more than replaced the losses in GDP and Retail Sales (figures above). Canada holds a small edge in the monthly sales average after June, 0.63% to 0.38%.
Business sentiment figures are a wash. The Ivey and ISM Indexes July readings were both higher in July than in February and have fallen back in November.
Canada holds a distinct advantage in rehiring, 80.9% to 55.4%. The US advantage in the unemployment rate is unimportant given the payroll numbers.
The 25% differential in US and Canadian payrolls, the most emblematic and meaningful statistic of the pandemic era, is notable. But it is not the rationale for the steady depreciation of the USD/CAD over five months (April to August) given the historical propensity for the US economy to be more extreme on both the firing and hiring sides of the labor equation. Markets do react to individual figures, but a solitary statistic does not suffice for a trend.
Further proof is that once the dollar's pandemic premium was fully extracted by the end of July, the USD/CAD duplicated the range of the prior two years despite the widening gulf between the Canadian and US labor markets.
One caveat on data, the return of layoffs in the United States in November and December along with the weak November payrolls and the inability of the US Congress to pass a second stimulus bill to that point, were the deciding factors in the drop of the USD/CAD through the two-year support at 1.2960 in early December.

Pandemic Policies: Canada and the US
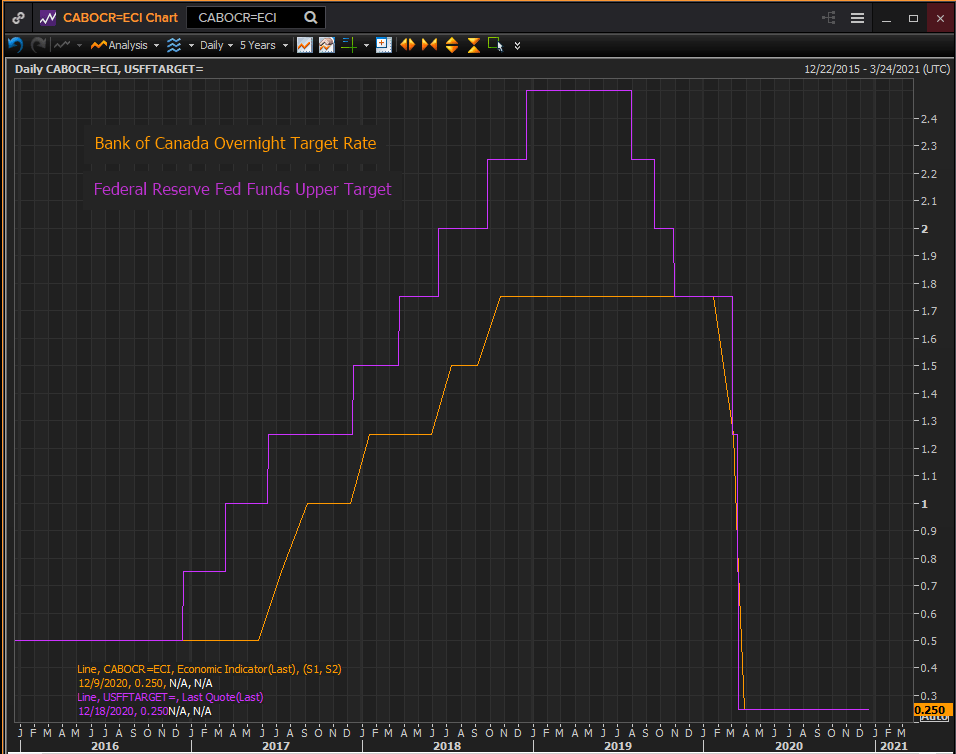
The Bank of Canada (BoC) and the Federal Reserve (Fed) were in lockstep in their pandemic responses.
The BoC cut rates three times, from 1.75% to 1.25% on March 4, to 0.75% on March 13 and to 0.25% on March 27. The Fed cut twice from 1.75% to 1.25% on March 3 and to 0.25% on March 15. The Fed also launched a $2 trillion loan program for local government and some businesses which has been largely ignored.
Reuters
Canada has spent about C$382 billion ($298 billion) on virus relief, most of which comes from Ottawa, equal to roughly 19% of the nation's total economic output. In the US, the Federal government spent $2.2 trillion in the CARES Act in March and will expense about $3.1 trillion, including the agreed $900 billion package, or about 14% GDP.
Pandemic risk premium: US dollar
Canadian and US economic data, central bank policy and fiscal responses are in essence the same through the first nine months of the pandemic.
It was the panic flood to the US dollar in the first two weeks of March that set the stage for the following five months of trading in the USD/CAD.
From the March 6 close at 1.3422 to the March 19 finish at 1.4514 the greenback rose 8.14% in nine trading sessions.
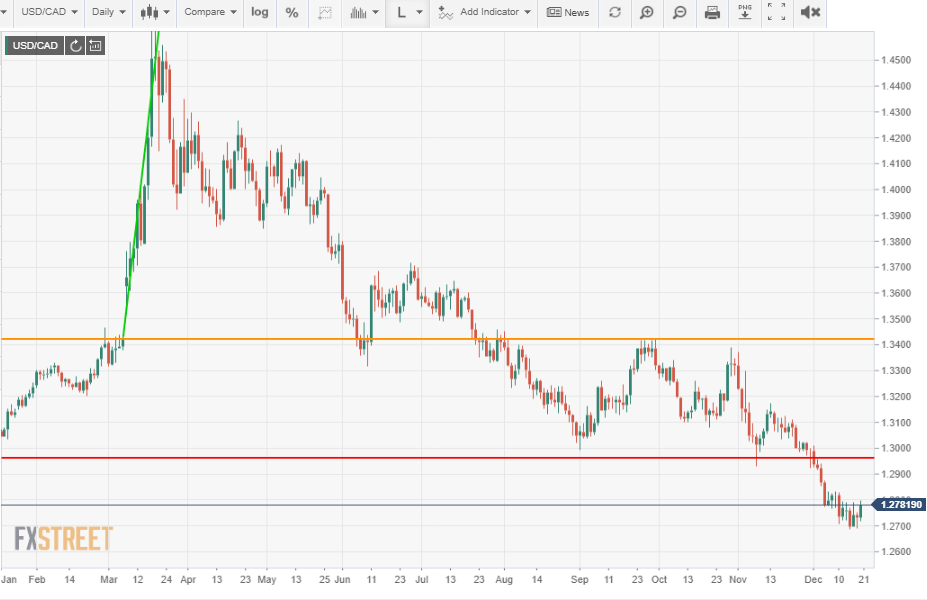
It took until the end of July for the market to completely recover from the COVID-19 shock and bring the USD/CAD back to the pandemic start line at 1.3400.
For the next four months (August to November) the USD/CAD traded in the same 1.3000 to 1.3400 range that had occupied the market, with three exceptions, for 21 months from June 2018 until the pandemic ascent in March. Throughout those four months, every decline in the USD/CAD was credited to the extraction of the pandemic premium, but after crossing 1.3400 there was no remaining premium.
In reality, the market was trading the comparative US and Canadian statistics and pandemic status. The proof is that when the US jobless claims and payrolls did deteriorate, the USD/CAD promptly fell through the 1.2960 support.

Markets anticipate recovery
Despite the increasing number of current lockdowns in Europe and the United States, markets are positioned for a global recovery in the next two quarters.
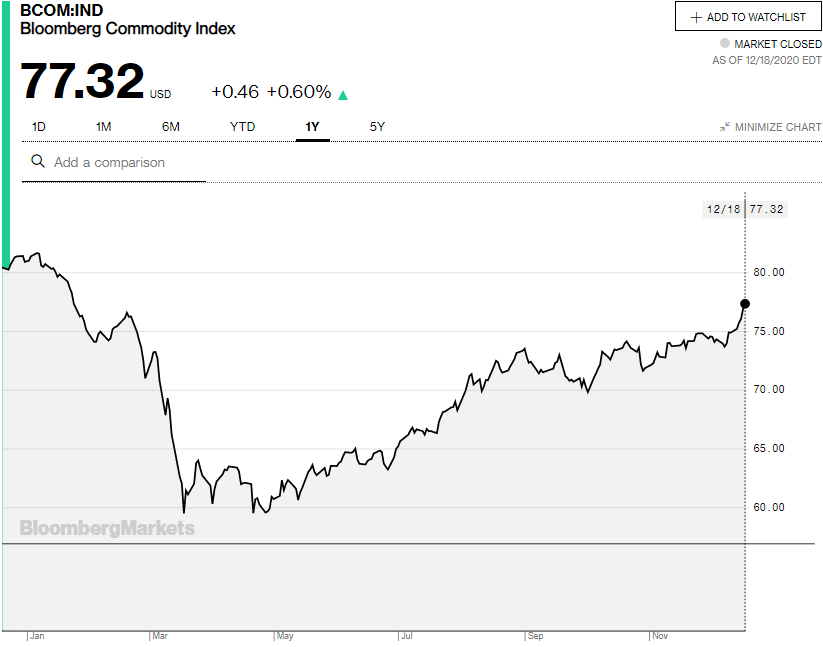
The Bloomberg Commodity Index (BCOM) closed at 77.32 on Friday, December 18, its highest level since the March collapse. It has gained 6.2% since the announcement of the Pfizer vaccine a week after the US presidential election.
West Texas Intermediate (WTI) finished at $49.18 on December 18, its best finish since February 25. The world's basic industrial and energy commodity has risen 30.6% since the vaccine news.

Finally, the three US equity averages closed at all-time records on December 17, the Dow at 30,303.37, the S&P 500 at 3,722.48 and the Nasdaq at 12,764.745.
Much has been made of the so-called Fed equity put, meaning the central bank's repression of interest rates that forces investment funds seeking return to the stock market.
There is little doubt that credit intervention has inflated stock prices. The 10-year Treasury yield at 0.945% (12/18) is less than half its five-year average and the Fed has promised to continue buying $120 billion a month until the economy is fully recovered.
We should, however, remember the lesson from the financial crisis. When central bank liquidity provisions are withdrawn markets do not revert to an objective value for stocks, but continue from that point.
USD/CAD 2021: First half fundamental trends
The recurrence of the pandemic and re-instituted defensive measures in many countries will continue to cripple most economies through the first quarter and with diminishing severity into the second, delaying recovery even as the vaccines hopefully ensure it.
But the market positioning that anticipates growth will not change unless it appears the eventual recovery or its strength will be seriously altered by the pandemic. To date that has not happened.
The USD/CAD levels that have been established in the final months of 2020 will remain accurate as the conditions that prompted them have not changed.
The Canadian dollar strength is justified by the following fundamental factors.
Commodity prices and crude oil have gained as markets look to a global recovery in the second and third quarters of 2021. The run in commodity prices is not complete. Although there is much anticipation that the global economy will boom once the pandemic straitjacket is removed, it has not happened yet.
Western Europe and the US can probably expect a drop in growth in the first quarter as the renewed closures hamstring economic activity. But once the recovery is underway Canada's large resource and oil-export industries will profit as commodity and oil prices continue higher returning to historical norms for a global expansion.
The commodity complex should provide additional support for the loonie well into the second quarter.
The recent superiority of Canadian economic data, primarily re-employment and retail sales, may or may not continue but the clear return of a US statistical advantage needed to affect the USD/CAD cannot occur until the American economy is operating at a much higher level than it is now. That is unlikely until at least the second quarter and more probably the third.
Finally, the Fed's avowal to continue restraining US interest rates, even to add repression if necessary, will keep the US dollar on the defensive as long as the economy is weak.
It is not that bond traders cannot override, at least partially, the Fed intervention. They can, and have in the past, but they require an excellent reason to do so. That permission is a booming US economy. Again, that is not likely, given the current situation, until the second quarter at the earliest.
To recap, continued commodity price strength, equivocal US economic statistics and Fed rate repression will keep the USD/CAD weak during the first half of 2021.
Despite the pressure on the USD/CAD in the first half of the year its decline will be relatively shallow due to the evolving and limiting circumstances of the second-half recovery.
As the global economy revs into the second half emphasis and performance will shift from the commodity and manufacturing economies to the consuming nations. For the USD/CAD that is from Canada to the United States, from the Canadian dollar to the American. We will cover that below.
Year-end markets
The last two weeks of the year are notorious for exaggerated movement enabled by the lack of liquidity as many commercial players close their books for the year.
At the close of 2019, the USD/CAD gained 2.4% from its 1.3350 close on December 12 to 1.3665 on December 31. By January 8 it was back to 1.3245, almost exactly where it had opened December at 1.3255. Given the rapid five-figure drop since mid-November this year and the limited rebound, USD/CAD might be in for a year-end surprise.
USD/CAD 2021: Second half fundamental trends
The timing of the economic recovery depends initially on the revocation of the pandemic's hold on the global economy and the consumer psyche.
Give the US consumer a reason to spend and there has rarely been a disappointment.
If the pandemic is defeated by the end of the second quarter, a notable if, then the second half of the year could be a party. The US economy and its dependence on consumer spending could, if the population is engaged, easily boom from July to next Christmas. The combination of psychological and practical relief from the pandemic, returning jobs and wages could give two or even three quarters of 5% annualized growth.
Were that or something akin to happen, the expansion would drive US yields higher, regardless of the Fed, though restrained by their intervention and US statistics would reflect the expansion. The USD/CAD would accrue the benefits to 1.3400.
USD/CAD 2021: Technical outlook
The main technical reference for the area below 1.3000 is the period from mid-July 2017 to May 2018. Trading levels at that remove provide weak resistance and support.
The USD/CAD drop from December 1 to December 15 that took the pair from 1.2988 to 1.2688 not only effortlessly crossed the support line at 1.2960, the 2020 low, but 1.2900, 1.2850, 1.2785 and 1.2745 that engage a series of trading levels from July 2017 through October 2018.
The deeper support structure from 1.2785 to 1.2450 will be unlikely to block a falling USD/CAD unless the run is limited by overextension or an external development, statistical or otherwise, that needs a convenient turning point.
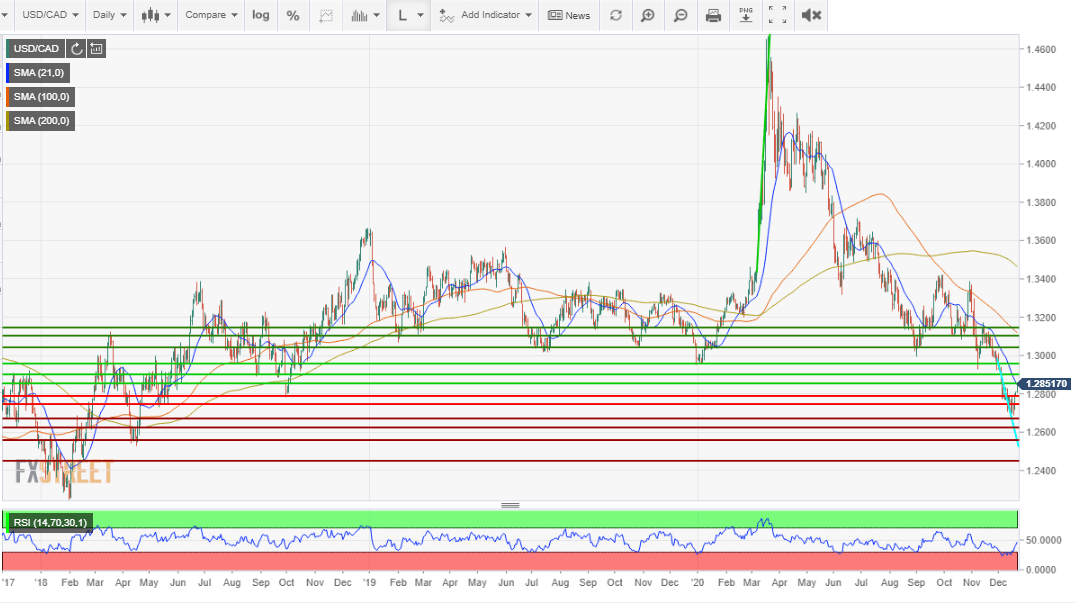
The first resistance lines are the three supports crossed in the first two weeks of December, 1.2850, 1.2900 and 1.2960. Of these, the last has the most weight being, prior to December, the 2020 and two-year low. Resistance lines at 1.3040, 1.3100, 1.3150 and higher are recent and have been true since October, effective at limiting a technical bounce.
The Relative Strength Index (RSI) is a short-term mean-reverting indicator and its recovery to 46.50 on December 20 from 22.72 on December 4 completes a cycle.
The moving averages are all part of the resistance. The 21-day at 1.2849 backs initial resistance at 1.2850, engaged as of this writing on December 21. The 100-day average at 1.3120 backstops the line at 1.3100 or fronts the line at 1.3150, as the average will bend higher as the USD/CAD moves up the latter will be a closer match. The 200-day line at 1.3463 is equal to resistance at 1.3460, the trading level in late July.
Resistance: 1.2850; 1.2900; 1.2960; 1.3040; 1.3100; 1.3150; 1.3240; 1.3330; 1.3400; 1.3460; 1.3530; 1.3620
Support: 1.2785; 1.2745; 1.2670; 1.2620; 1.2560; 1.2450
RSI and moving averages reference their position on Monday morning December 21 in the Asian market.
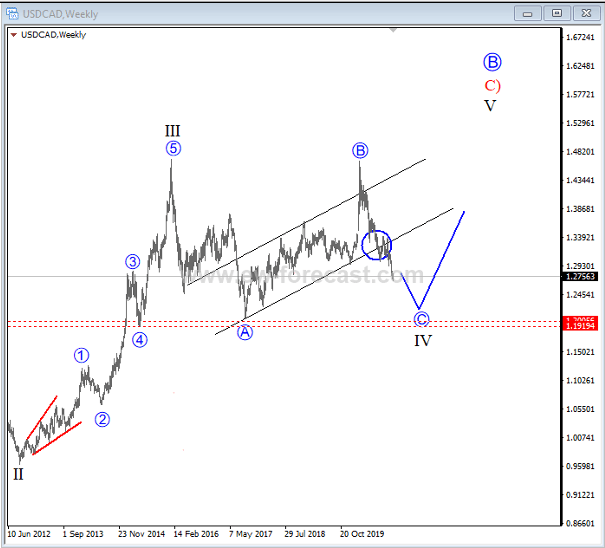
Gregor Horvat projects a long-term recovery for the loonie pair on his Elliott Wave analysis:
USD/CAD Elliott Wave Analysis

USDCAD is weakening and it may see more weakness within current wave C which can be part of a wave IV, either as a flat or even a triangle, but in both cases there can be more weakness coming towards 1.2400 after a bounce.
Forecast Poll 2021
| Forecast | Q1 - Mar 31st | Q2 - Jun 30th | Q4 - Dec 31st |
|---|---|---|---|
| Bullish | 18.2% | 14.3% | 11.8% |
| Bearish | 54.6% | 48.6% | 44.1% |
| Sideways | 27.3% | 37.1% | 44.1% |
| Average Forecast Price | 1.2763 | 1.2635 | 1.2392 |
| EXPERTS | Q1 - Mar 31st | Q2 - Jun 30th | Q4 - Dec 31st |
|---|---|---|---|
| Alberto Muñoz | 1.2520 Bearish | 1.2230 Bearish | 1.2050 Bearish |
| Andrew Lockwood | 1.2900 Sideways | 1.2500 Bearish | 1.2000 Bearish |
| Andria Pichidi | 1.2600 Bearish | 1.2500 Bearish | 1.2300 Bearish |
| BBVA FX Team | 1.3200 Bullish | 1.2900 Sideways | 1.2700 Sideways |
| Brad Alexander | 1.2500 Bearish | 1.3000 Sideways | 1.3000 Sideways |
| Commerzbank Analyst Team | 1.3100 Sideways | 1.3000 Sideways | 1.2800 Sideways |
| Dmitry Lukashov | 1.2300 Bearish | 1.2000 Bearish | 1.2100 Bearish |
| Dukascopy Bank Team | 1.2400 Bearish | 1.2065 Bearish | 1.2600 Sideways |
| Eliman Dambell | 1.3600 Bullish | 1.4300 Bullish | 1.3900 Bullish |
| FP Markets Team | 1.2550 Bearish | 1.1800 Bearish | 1.2900 Sideways |
| Frank Walbaum | 1.2600 Bearish | 1.2800 Sideways | 1.3300 Sideways |
| George Hallmey | 1.2200 Bearish | 1.2800 Sideways | 1.0500 Bearish |
| Giles Coghlan | 1.2400 Bearish | 1.2200 Bearish | 1.1600 Bearish |
| Grega Horvat | 1.2600 Bearish | 1.3000 Sideways | 1.3400 Bullish |
| Jamie Saettele | 1.3000 Sideways | 1.2200 Bearish | 1.1200 Bearish |
| Jeff Langin | 1.2600 Bearish | 1.2400 Bearish | 1.2800 Sideways |
| Jeffrey Halley | 1.2000 Bearish | 1.1000 Bearish | 1.0500 Bearish |
| JFD Team | 1.2250 Bearish | 1.1920 Bearish | 1.1280 Bearish |
| Joseph Trevisani | 1.2500 Bearish | 1.2200 Bearish | 1.2200 Bearish |
| JP Morgan Global FX Strategy | - | 1.3000 Sideways | 1.2600 Sideways |
| Kaia Parv, CFA | 1.2760 Sideways | 1.3100 Sideways | 1.2800 Sideways |
| M.Ali Zah | 1.3225 Bullish | 1.3400 Bullish | 1.3800 Bullish |
| Matthew Levy, CFA | 1.2600 Bearish | 1.2500 Bearish | 1.2500 Sideways |
| Murali Sarma | 1.2598 Bearish | 1.2993 Sideways | 1.2300 Bearish |
| Navin Prithyani | 1.3000 Sideways | 1.2600 Sideways | 1.2300 Bearish |
| Paul Dixon | 1.2700 Sideways | 1.2700 Sideways | 1.2700 Sideways |
| Rick Ackerman | - | 1.2239 Bearish | - |
| RoboForex Team | 1.3891 Bullish | 1.4565 Bullish | 1.3101 Sideways |
| Sachin Kotecha | 1.2000 Bearish | 1.1000 Bearish | 1.0500 Bearish |
| Standard Bank Research Team | 1.2800 Sideways | 1.2700 Sideways | 1.2600 Sideways |
| Stephen Innes | 1.3200 Bullish | 1.3400 Bullish | 1.3600 Bullish |
| Theotrade Analysis Team | 1.4500 Bullish | 1.4000 Bullish | 1.3000 Sideways |
| Unicredit Research | 1.2900 Sideways | 1.2700 Sideways | 1.2500 Sideways |
| Walid Salah El Din | 1.2700 Sideways | 1.2500 Bearish | 1.2400 Bearish |
| Yohay Elam | 1.2500 Bearish | 1.2000 Bearish | 1.1500 Bearish |
The initial sell-off in the markets will again drive the dollar higher, retrace by Q2 and reverse by the end of the year..
Risk of a strong reaction early in 2021 for commodity FX but oil strength underpins CAD strength more so than copper does for AUD early in the year. The 61.8% retrace of the rally from 2007 1.12
Premium
You have reached your limit of 3 free articles for this month.
Start your subscription and get access to all our original articles.
Author

Joseph Trevisani
FXStreet
Joseph Trevisani began his thirty-year career in the financial markets at Credit Suisse in New York and Singapore where he worked for 12 years as an interbank currency trader and trading desk manager.


