USD/CAD Forecast: CAD crumbles under cruel crude
- The Canadian Dollar was hit by oil prices once again.
- The quarterly GDP figure stands out in the last week of November.
- The technical picture is quite bullish for the pair. The FX Polls shows a short-term rise but ongoing falls afterward.

This was the week: Another leg down in oil
Oil prices continue taking two steps down, one up. Prices tumbled down once again alongside stock markets. The recoveries were shallow the prices of black gold, whether Brent or WTI, are the lowest levels in more than a year.
Worse off, Canadian crude sells at a discount, so prices are even lower. An increase in inventories and Trump's happy tweets about falling oil prices may be seen as the triggers for the most recent slide, but the broader picture is of oversupply and not enough demand.
Canadian events: GDP stands out
Oil prices remain on center stage, with the weekly inventory report on Wednesday standing out. Any comments by Saudi Arabia, Russia or Trump on prices may also move the price and the Canadian Dollar.
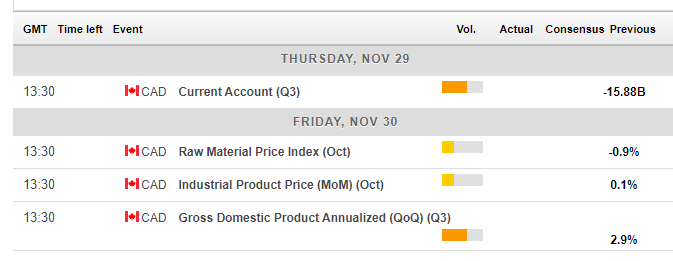
In addition, there are a few noteworthy economic releases. Canada's Current Account for Q3 is due on Thursday and will likely show another deficit. The monthly trade balance numbers occasionally show a surplus.
The most significant release is on Friday with the GDP report. This time, the publication is for September, the last month of Q3, which means Canada also publishes the quarterly number.Q2 was a "comeback" quarter with 2.9% QoQ after a soft path in Q1. Growth may have slowed down in Q3.
Here is the Canadian calendar for this week:
US events: FOMC Minutes, GDP update, and the trade summit
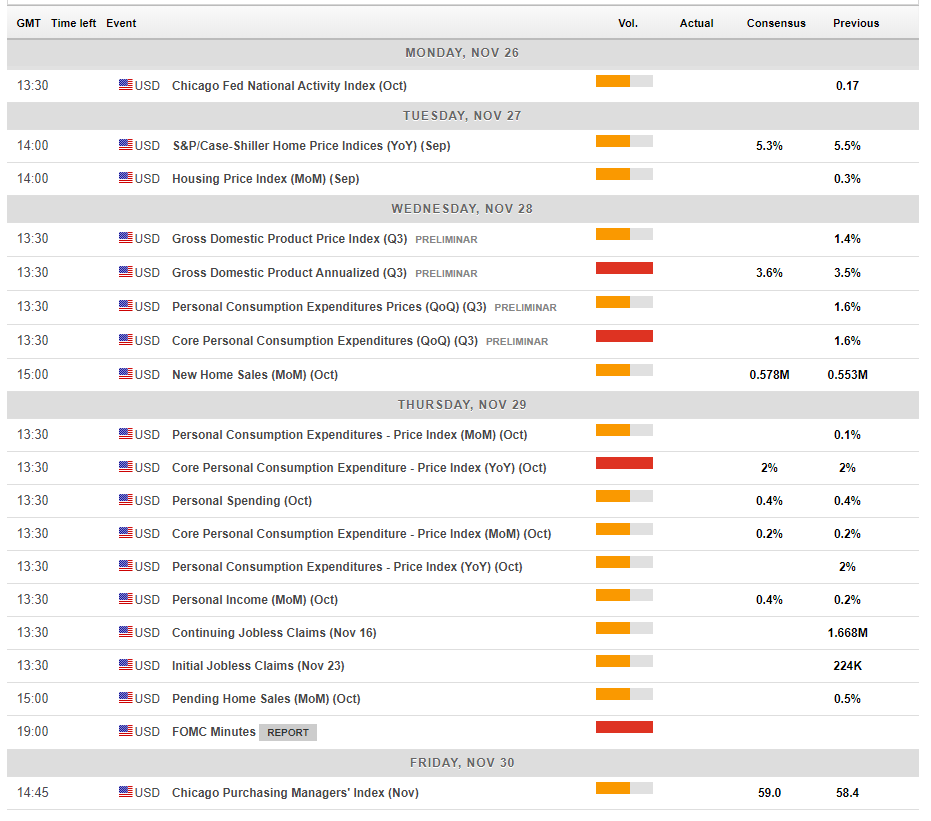
After a light week on the US calendar, the last week of November is packed. Housing figures kick off the week in earnest on Tuesday. The sector has shown signs of a slowdown.
The most important economic indicator is due on Wednesday with the second release of Q3 GDP. It will likely be along the lines of the first release, which showed an annualized growth rate of 3.5%, slower than Q2 but quite impressive in absolute terms. However, a high growth rate of inventories and a drop in exports are causes for worry. The components matter no less than the headline figure.
The Fed's favorite inflation measure is due on Thursday: the Core PCE Price Index is projected to remain at an annual rate of 2%, bang on the Fed's target. These projections come despite a slide in the parallel Core CPI to 2.1%.
More importantly on Thursday, the Fed publishes the FOMC Meeting Minutes from the November meeting that did not include a press conference. In the past, the central bank used the event to convey a clear message about an upcoming rate hike. This time, uncertainty is higher after the recent dovish comments from several members of the Fed. Many analysts estimate that Jerome Powell and his colleagues will raise rates in December but signal a pause sometime in 2019.
Here are the critical American events from the forex calendar:
USD/CAD Technical Analysis
USD/CAD continues trading alongside an uptrend support line that accompanies it since the October 1st trough at 1.2775. The Relative Strength Index is below 70, indicating overbought conditions and Momentum is upbeat. All are bullish signs.
The pair is struggling with 1.3225 that capped the pair in early September. 1.3265 was the peak recorded last week and is a resistance line. 1.3320 is the high point seen this week and the highest since June. The 1.3380 level looms above: it was the peak in May.
Looking down, 1.3175 supported the pair in late November and capped it in August. 1.3135 provided support in mid-November. 1.3050 awaits below after supporting USD/CAD early in the month.
All in all, the bias remains bullish.
-636785692672175886.png)
USD/CAD Sentiment
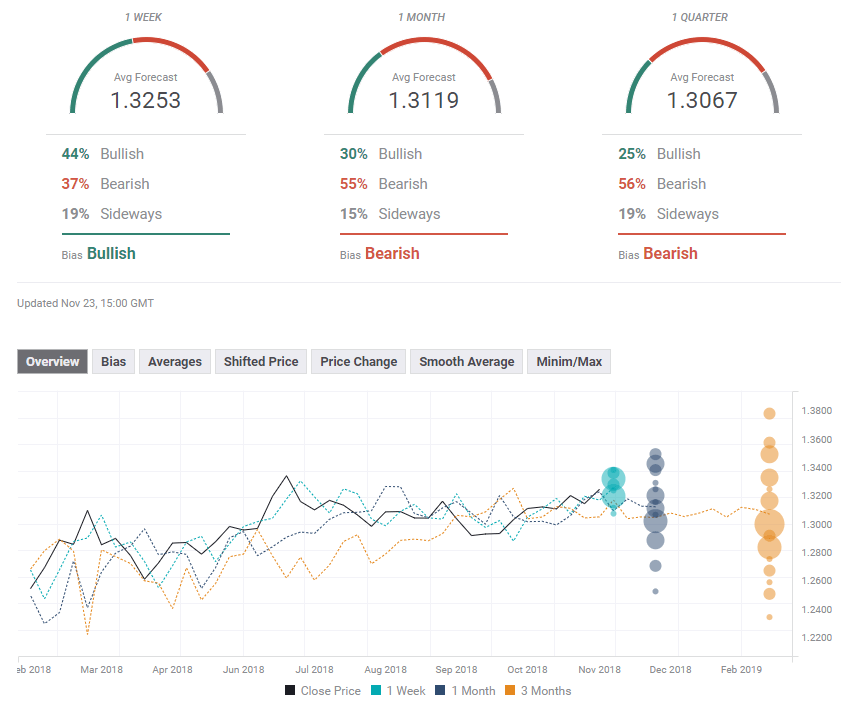
There are growing signs of a global slowdown. While the BOC is still on course to raise rates, so is the Fed. However, the Canadian Dollar is a risk currency and is therefore set to suffer alongside a drop in stocks and perhaps even more pressure on oil. USD/CAD has more room to the upside than to the downside.
The FXStreet forex poll of experts shows a bullish move in the short term but a reversal afterward. The average forecasts have been downgraded for the long-term. Do experts see this oil crash as temporary?
Related Forecasts
Author

Yohay Elam
FXStreet
Yohay is in Forex since 2008 when he founded Forex Crunch, a blog crafted in his free time that turned into a fully-fledged currency website later sold to Finixio.