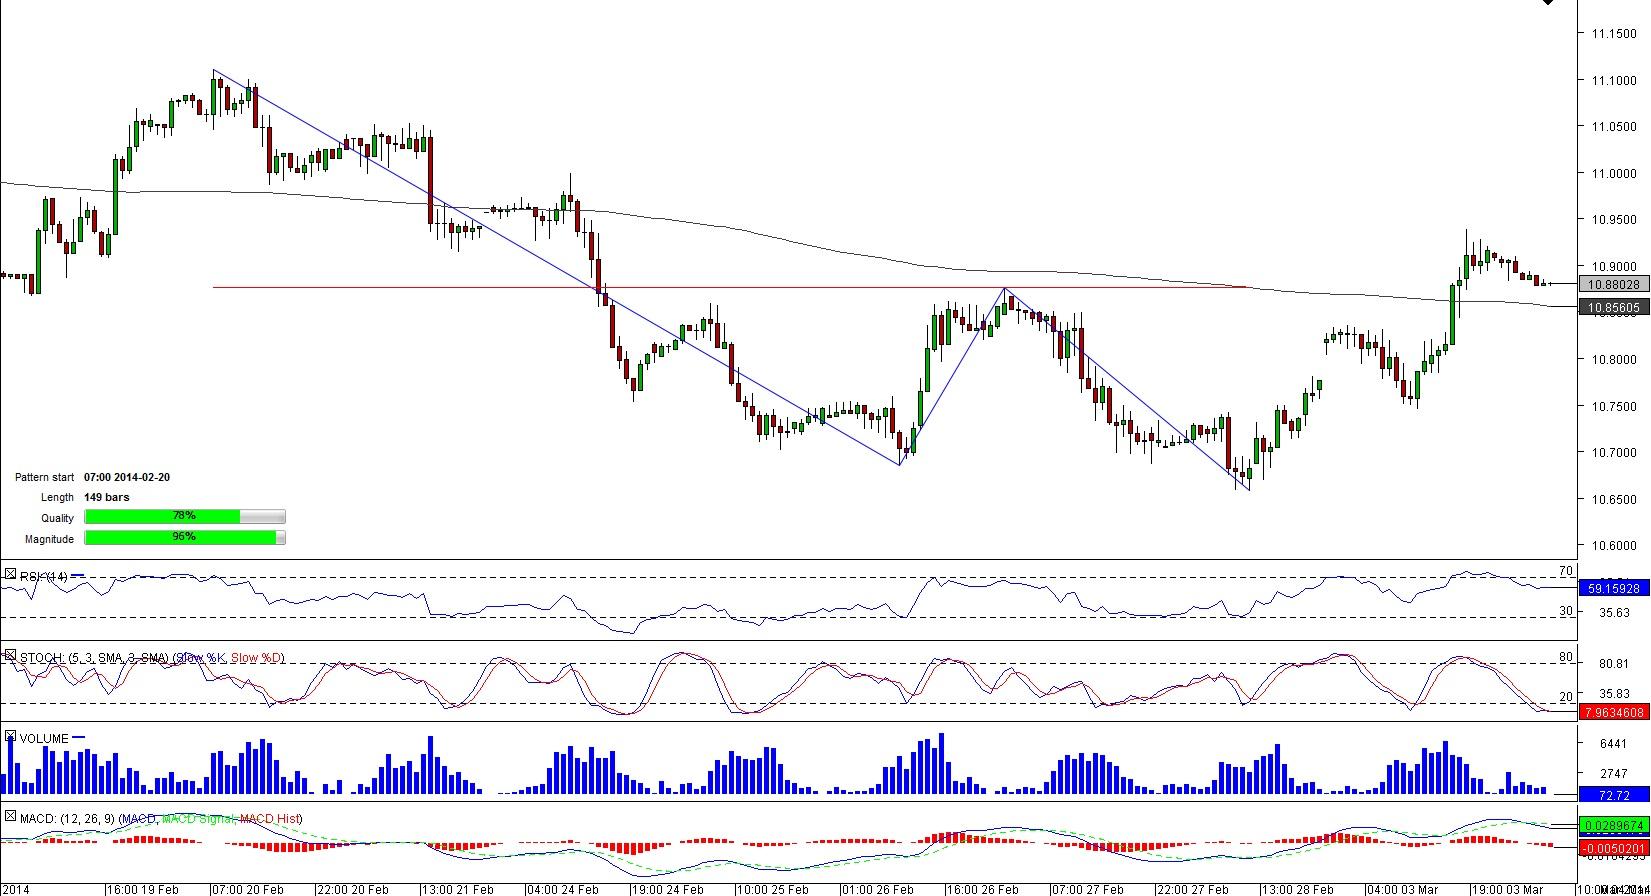
USD/ZAR 1H Chart: Double Bottom
Comment: A gradual retreat from more than a five-year high of 11.3952 impelled USD/ZAR to embark upon formation of a double bottom pattern.
The pattern was broken through several hours earlier when the pair breached the neck-line at 10.8762 that represented a formidable resistance, especially given that it was propped up by the 200-hour SMA sitting at 10.8550. However, a rally that usually follows a breakout from double bottom pattern appeared to be short-lived. Recently the currency couple dived below the neck-line and may extend losses in future. This is also supported by market players who are bearish in 60% of cases.
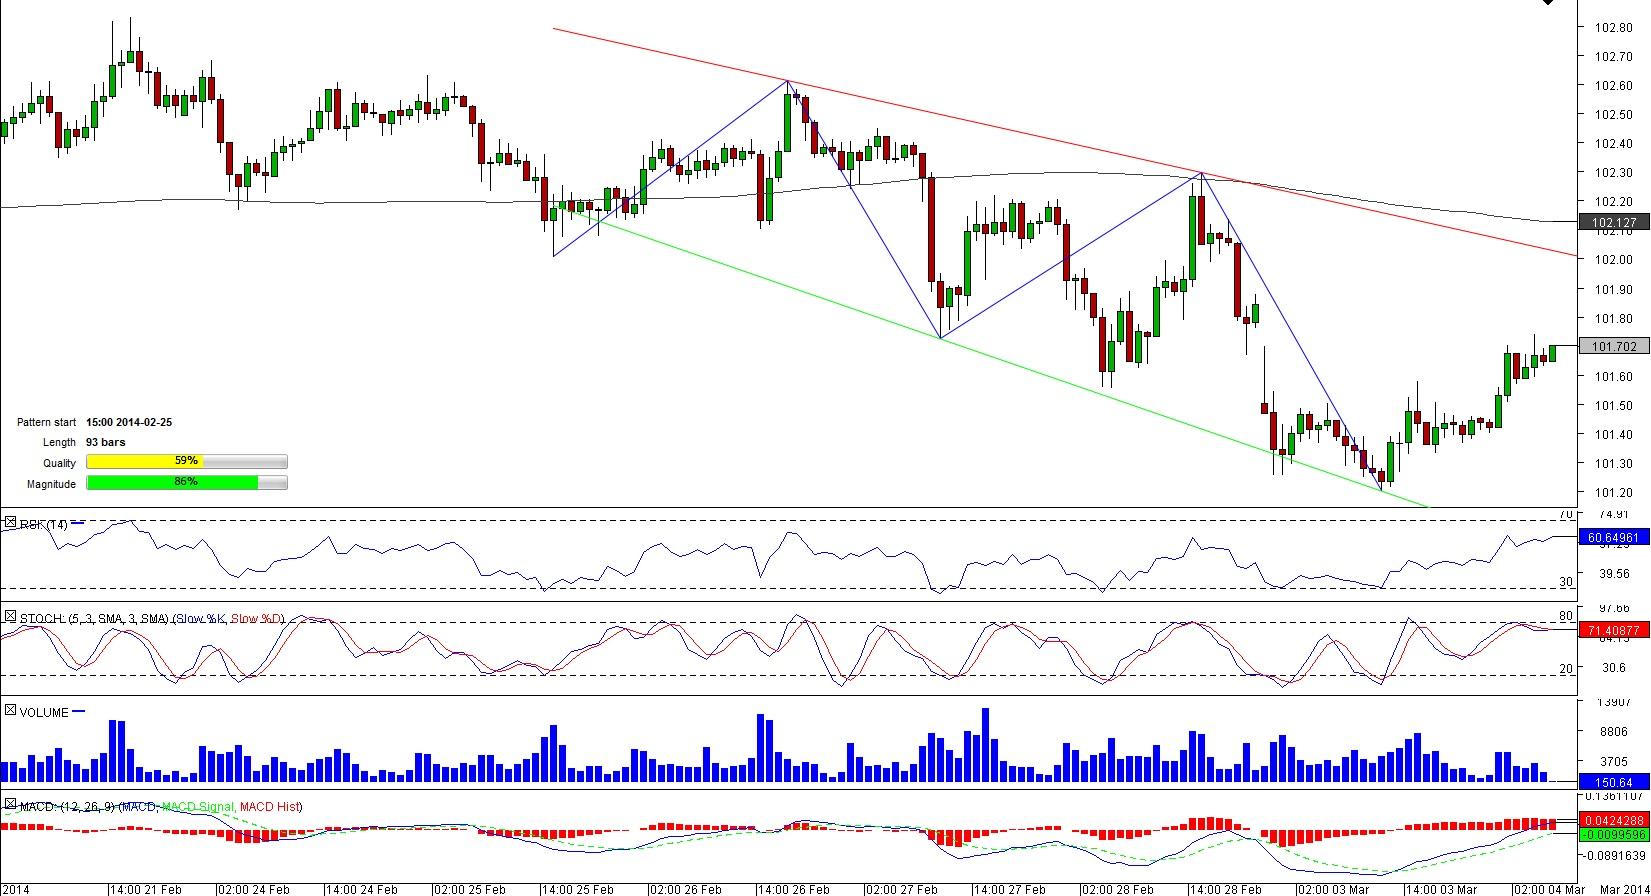
USD/JPY 1H Chart: Broadening Falling Wedge
Comment: The U.S. Dollar has been depreciating against the Japanese Yen since February 25 when the pair started to shape a broadening falling wedge pattern. Now the pattern is 93-bar long and has average quality but high magnitude.
Up to now the pair has not shown any willingness to exit the range bounded by two diverging lines. Currently, USD/JPY is moving towards the upper limit of the pattern after it touched the lower boundary several hours earlier. The pair is likely to reach the pattern’s resistance in the hours to come taking into consideration that 62% of traders bet on appreciation of the pair.
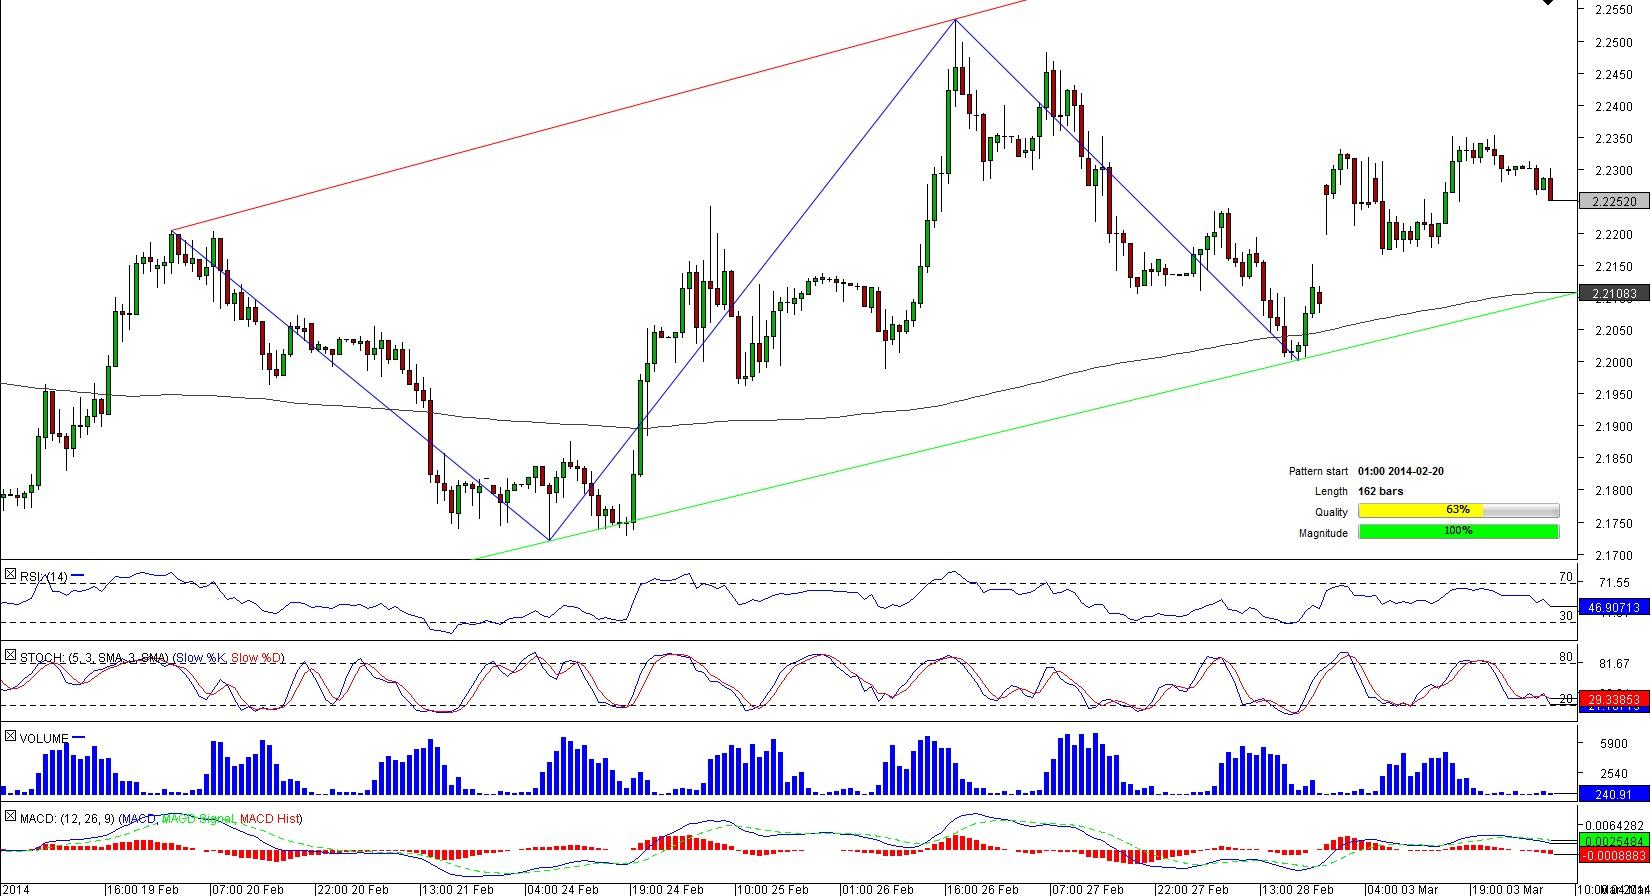
USD/TRY 1H Chart: Channel Up
Comment: USD/TRY attained a record-high of 2.3909 late January that prompted the Turkish central bank to intervene to contain depreciation of the national currency. After that, the pair followed a pronounced downside trend for some time; however, the pair halted a drop in mid-February and commenced a formation of the channel up pattern.
At the moment, USD/TRY is succumbing to the selling pressure that is pushing the instrument below the 50-hour SMA at 2.2210. Nevertheless, 75% of market players are bullish on the pair. Besides, technical data is sending ‘sell’ signals for the medium term.
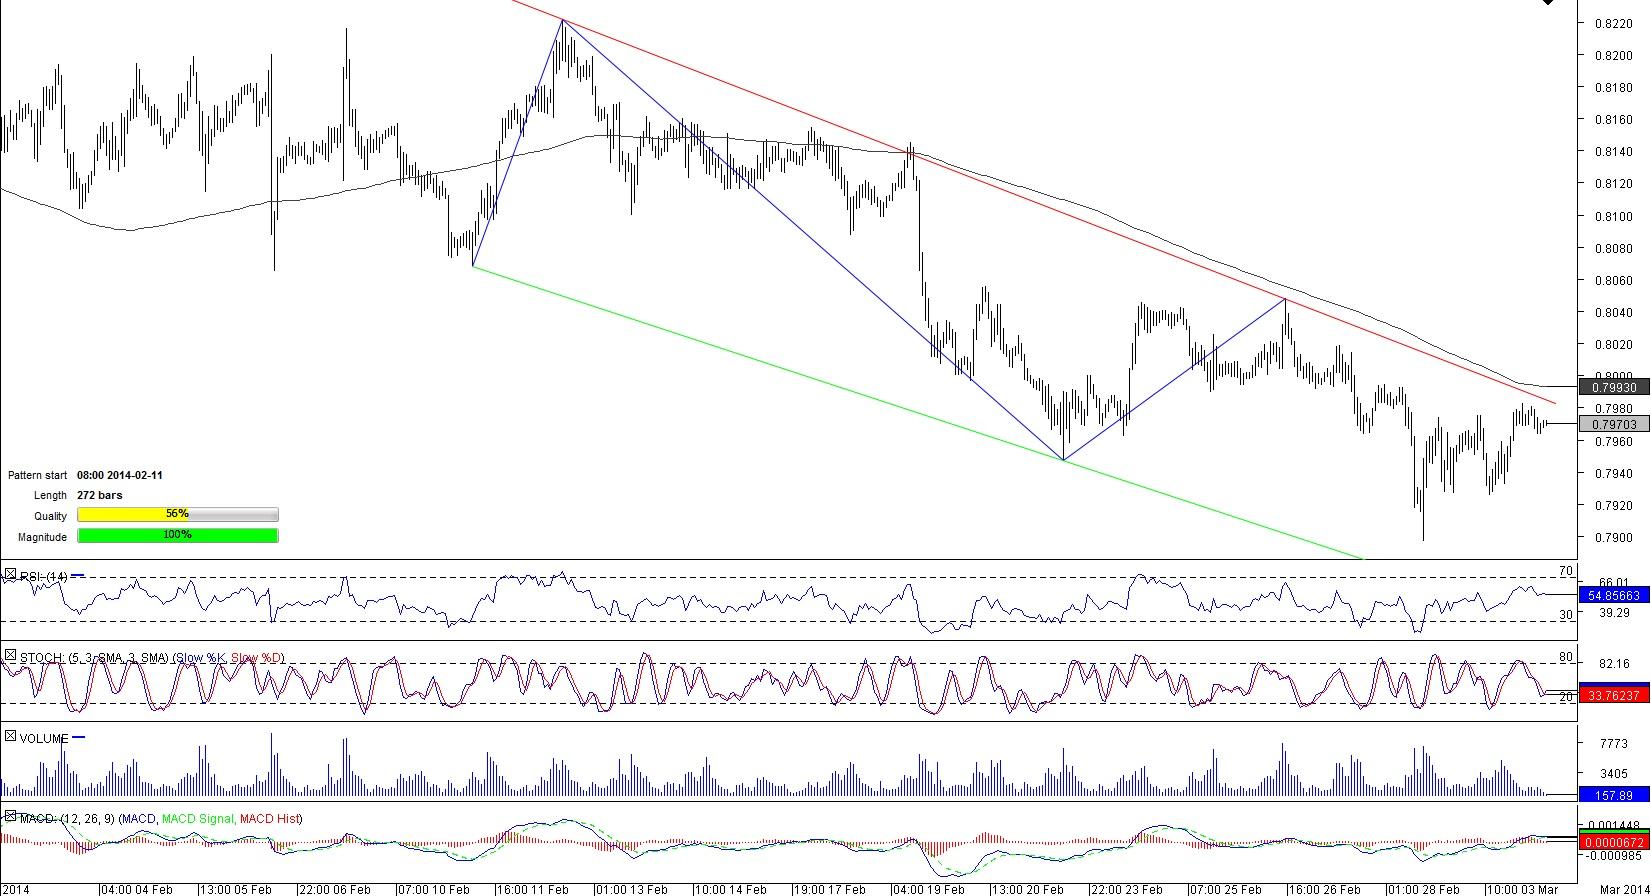
CAD/CHF 1H Chart: Channel Down
Comment: Since the very beginning of the year, the Canadian Dollar has been losing ground against the Swiss Franc; in mid-February the decline became more distinct and the pair was trapped by two downward sloping lines.
Now CAD/CHF is trading above the 50-hour SMA at 0.7957 that lies near the upper boundary of the 272-bar long channel down pattern. Despite a climb to the current level, the pair is still vacillating close to a recent low, 0.7897, the lowest mark in since 2011. According to technical data, CAD/CHF may prolong its advance to the pattern’s resistance in the nearest future; however, it is likely to swing to losses in the longer term.
This overview can be used only for informational purposes. Dukascopy SA is not responsible for any losses arising from any investment based on any recommendation, forecast or other information herein contained.
Recommended Content
Editors’ Picks
EUR/USD clings to gains above 1.0750 after US data

EUR/USD manages to hold in positive territory above 1.0750 despite retreating from the fresh multi-week high it set above 1.0800 earlier in the day. The US Dollar struggles to find demand following the weaker-than-expected NFP data.
GBP/USD declines below 1.2550 following NFP-inspired upsurge

GBP/USD struggles to preserve its bullish momentum and trades below 1.2550 in the American session. Earlier in the day, the disappointing April jobs report from the US triggered a USD selloff and allowed the pair to reach multi-week highs above 1.2600.
Gold struggles to hold above $2,300 despite falling US yields

Gold stays on the back foot below $2,300 in the American session on Friday. The benchmark 10-year US Treasury bond yield stays in negative territory below 4.6% after weak US data but the improving risk mood doesn't allow XAU/USD to gain traction.
Bitcoin Weekly Forecast: Should you buy BTC here? Premium

Bitcoin (BTC) price shows signs of a potential reversal but lacks confirmation, which has divided the investor community into two – those who are buying the dips and those who are expecting a further correction.
Week ahead – BoE and RBA decisions headline a calm week

Bank of England meets on Thursday, unlikely to signal rate cuts. Reserve Bank of Australia could maintain a higher-for-longer stance. Elsewhere, Bank of Japan releases summary of opinions.


