The changing investment case for gold in 2020

We head into one of the biggest weeks for event risk in some time and arguably the overriding risk plays out this weekend, where we find out if the scheduled 15% tariffs on $160b of Chinese exports (to the US) kick in. The consensus is we see a loose agreement to suspect the implementation of tariffs and to revisit talks and tariffs in late January/early February 2020. Of course, we could feasibly see tariff rollbacks, but that seems even more unlikely, and that would cause a strong positive reaction.
There has been some modest buying of USDCNH (offshore yuan) 1-week implied volatility, which tells me there are rising expectations of a move in spot USDCNH, but at 6.0425% it’s still very calm. We’ve seen some genuine interest in gold as a hedge against a negative reaction in risk from a tariff increase and certainly well above average volumes. I guess this is an out-of-consensus view, certainly when we contrast to the price action on the daily or weekly chart. as gold is finding sellers easy to come by and not a universally welcomed hedge.
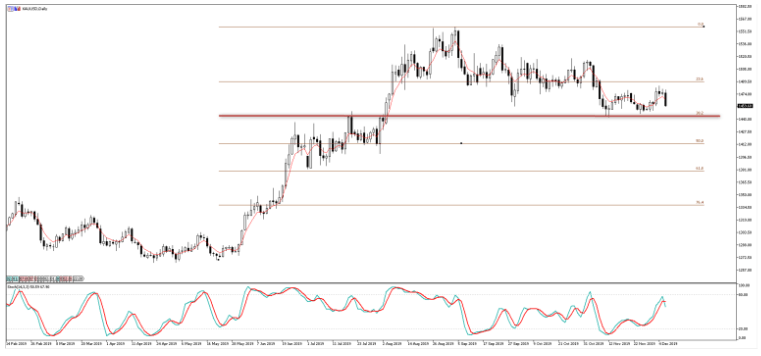
That said, if you do see the 15% tariffs kick in then gold should fly on Monday and the bulls will want to see a break of $1484. However, a further positive feel to risk sentiment and we test $1447 – the 38.2% fibo of the May to September rally. A break here and we’d expect a quick test of $1400.
The investment landscape
Trade talks are still the clear driver, but I wanted to take a step back and look at gold in a far more holistic oversight, to get a sense of the various dynamics driving price.
Gold vs the total $ value of government bonds outstanding with a negative yield (yellow). The lower pane (green) shows the percentage of all bonds with a negative yield. Up until September, gold was used a hedge against diminishing expected returns in the bond market, where the fact that gold has no yield was seen as yield in itself. That correlation has broken down, but it also tells me that the world is less bad and that bond yields have broadly risen. In a world not seeing the case for Armageddon as pronounced, the opportunity cost of holding an asset with no yield is important.
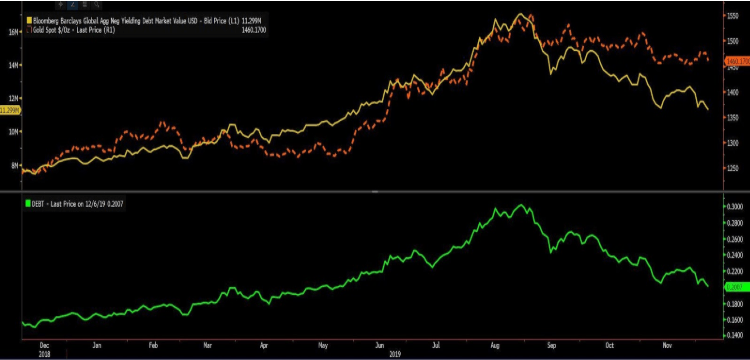
(Source Bloomberg)
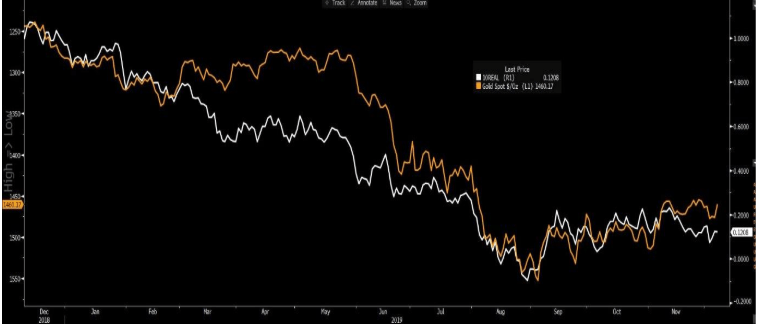
Gold vs the US 10-year ‘real’ Treasury yield (inverted) – Here we see the relationship between gold and real (i.e. inflation-adjusted) yields still in play, although this correlation is starting to look a little shaky. I guess the (inverse) correlation held true when nominal bond yields were falling faster than inflation expectations, thus, we saw subdued ‘real’ returns in what was a bullish backdrop for fixed income. The opposite is now true if we look at the current set-up….that’s why in an environment of rising inflation expectations, I feel lower ‘real’ yields will not be as bullish for gold going forward.
Breaking this down, we see US 10-year inflation expectations (red), a tradeable instrument that fixed-income investors can use to express a view on future inflationary trends, pulling higher from the nominal 10-year US Treasury (white). This is keeping ‘real’ yield at low levels, yet gold is finding sellers, backing my point above. The yellow line looks at US 5-year inflation expectations (starting in five-years’ time), which sounds odd, but this is a market-based inflation guide that the Fed looks at very closely.
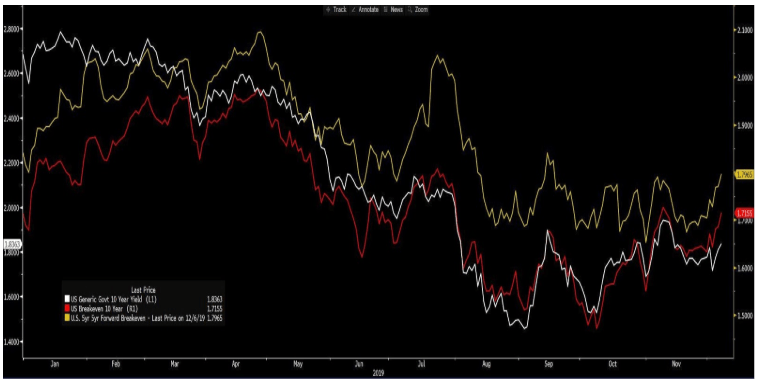
What’s important here is, while still well below the magical 2% threshold, inflation expectation are headed higher. The ‘reflation’ trade is one many strategists are calling for 2020 and if this gets legs gold may struggle; again, we think opportunity cost.
Economic data is stabilising – Friday’s US payrolls were clearly very strong and that would not have gone unnoticed for those trading US equities or the USD. Yet its manufacturing, investment and trade volumes that need to really convince us we are to see better times ahead.
-
Blue – JP Morgan global manufacturing PMI print
-
White – US ISM Manufacturing
-
Green – Philadelphia semiconductor index
-
Orange – South Korea manufacturing new orders
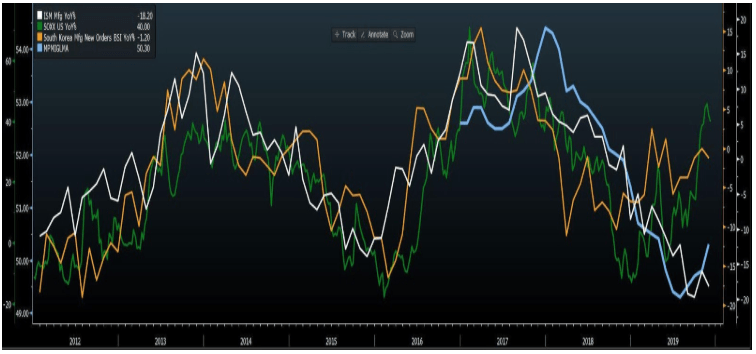
While the US manufacturing still has to formally turnaround, the market has taken heart to the improvement in global manufacturing (blue) – the first uptick in seven months. Of course, manufacturing is a small contributor to many economies GDP these days, but it is still considered one of the first to react to policy stimulus. The next US ISM manufacturing print is seen on the 4 January and any rebound will only aid this ‘reflation’ sentiment.
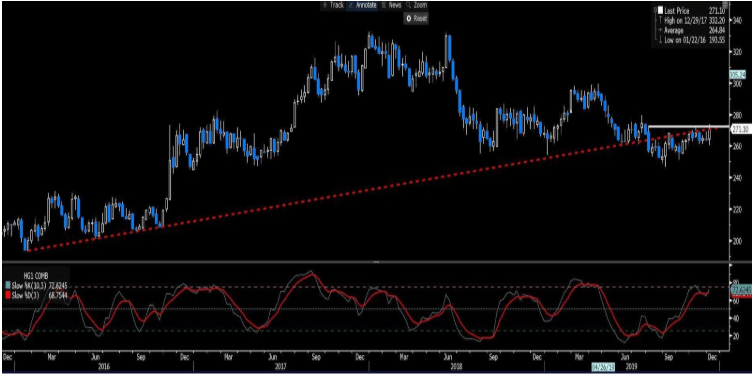
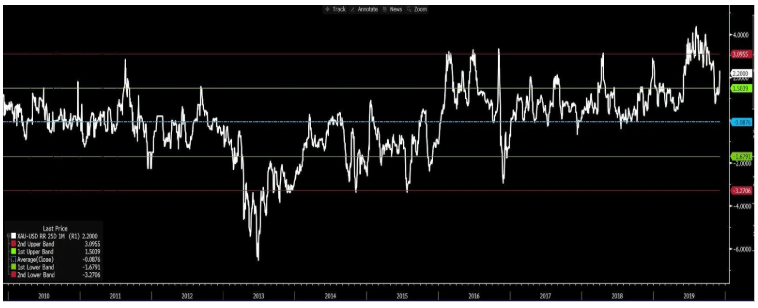
Copper – One clear way to view reflation is through the copper price and as we see in the weekly chart, copper is putting in a decent bottom. We’re back testing the former uptrend and have horizontal resistance in play. It looks quite constructive and if we are indeed in for better slightly times in 2020, which is a big ‘if’, but it’s a growing view in research shops, then copper is one to watch. Higher copper, lower gold I guess.
Bloomberg Industrial metals index – Trading off the multi-month range lows. If this tracks higher it will through weight behind the reflation story. Still, a lot of work to be done here.
Trading dynamics
We’ve looked at the technical picture and the investment backdrop, which both argue for caution when considering piling into longs. However, we should also consider positioning, sentiment and implied volatility.
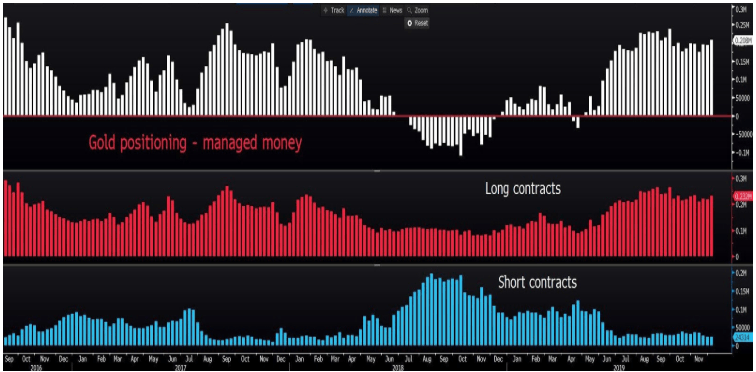
Positioning – If I look at the weekly Commitment of Traders report we can see that managed money has been reducing short positions in gold futures while increasing gross longs. The net position is has clearly been at elevated levels for a while, although, that is not a reason to short gold.
Gold one-month skew (risk reversals) – Risk reversals effectively look at options markets and, in this case, 1-month call implied volatility minus 1m put volatility. The greater the anticipated move in an underlying, the higher the demand and subsequently higher implied volatility. Thus, if call volatility is increasing in demand relative to puts, it shows that traders see the likely move in price moving higher.
Here we see call (bullish) volatility increasing over puts (bearish) and moving back above the 1-standard deviation line of the 10-year average. Options traders, rightly or wrongly, are betting on a bigger upside move than downside. Perhaps this is where we see the hedge on a tariff increase.
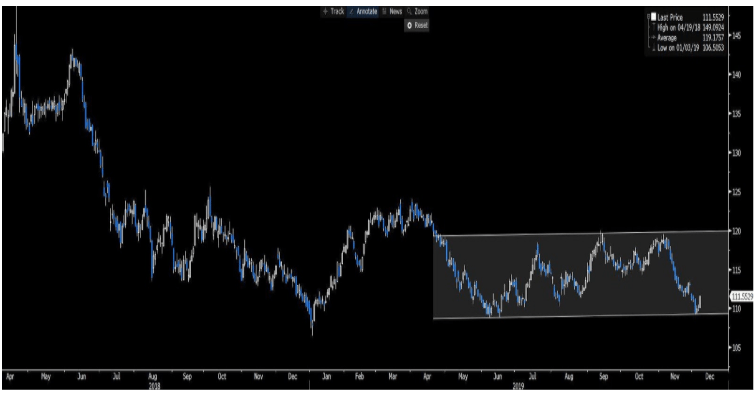
Another consideration is the USD. I have looked at the weekly chart of the USD index and drawn a regression channel here to show how the price is respecting the outliers of the line of best fit. It seems until this channel is broken the USD is going to grind higher. This is key for me because if I want to short gold, I’ll do it in the strongest currency, while if I want to go long gold ill do it in a currency ex-USD.
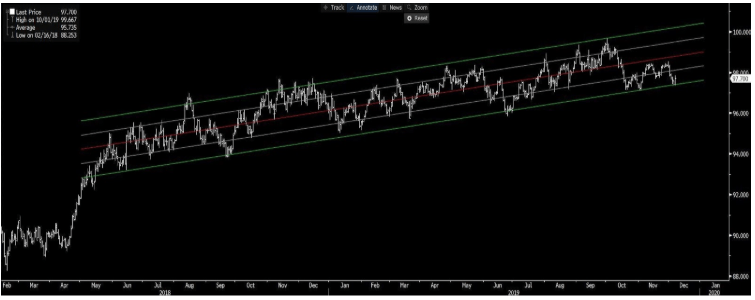
Does this chart argue for a bounce in the USD?
Summary
So, the bottom line is we head into a crucial time in US-China trade, and a clear binary event, with the prospect of pronounced gapping risk if tariffs do kick in. This, to many would be unexpected, hence the expected bearish reaction through markets, but it is a reason to own gold going into the event, which is what we are seeing in the options market. Still, if we see the status quo maintained it is my belief that investors are looking at world in in 2020 that is modestly better and the need to own gold less compelling. The idea of a greater reflationary environment should work against gold in 2020.
Author

Chris Weston
Pepperstone
Chris Weston recently joined Pepperstone as Head of Research.


