Technical Structure on Currency Markets – How to Trade and Analyze the Global Markets for Bigger Profits

It has been a very tough period for financial markets.
Sentiment has been shifting from extreme optimism and “this time is different” mentality to completely the opposite side, pessimism, very negative outlooks and questions like, “is this the top of the bull market?”
All, that within two weeks!
This is not another article where we will start bragging about how clever we are and how we were the only ones who nailed it.
Everyone trading professionally should know better and remain humble.
However, the truth is that we had a very different global macro-economic outlook since the end of 2017 and that was reflected in our articles, portfolios and trade calls.
The purpose of this article is to explain things practically from a technical analysis perspective and how we traded the markets the last couple of weeks.
I will just mention briefly the fundamental reasons that led us to have a diverging view against popular financial media and other professional views.
It was all about debt, inflation and growth.
Inflation has been moving higher globally but we started noticing that it was stagnant, and it would be very difficult in this environment to move much higher.
Global growth was slowing down and that was crystal clear! We had no doubt about this.
The only economy diverging was US. Why was the US economy diverging? It was because the fiscal measures introduced by the Trump administration and high levels of debt. But, what happens when the impact of fiscal policy is removed? You are left with record breaking debt, a central bank which cannot do much because they already tried the recipe of QE and failed and much higher costs for the US government and the consumers, due to the higher interest rates.
Of course, we could elaborate much more on these fundamental topics but as we said this article is about a technical perspective and how we trade the markets.
So, let’s dive into technical!
Please keep in mind that all our calls and analysis has been presented to our students and clients, live, either through live sessions or in our FX Desk.
Usually, we begin our technical analysis with the Dollar Index, USDX.
This is the market profile chart we use overlaid on top of the 4H candlesticks.
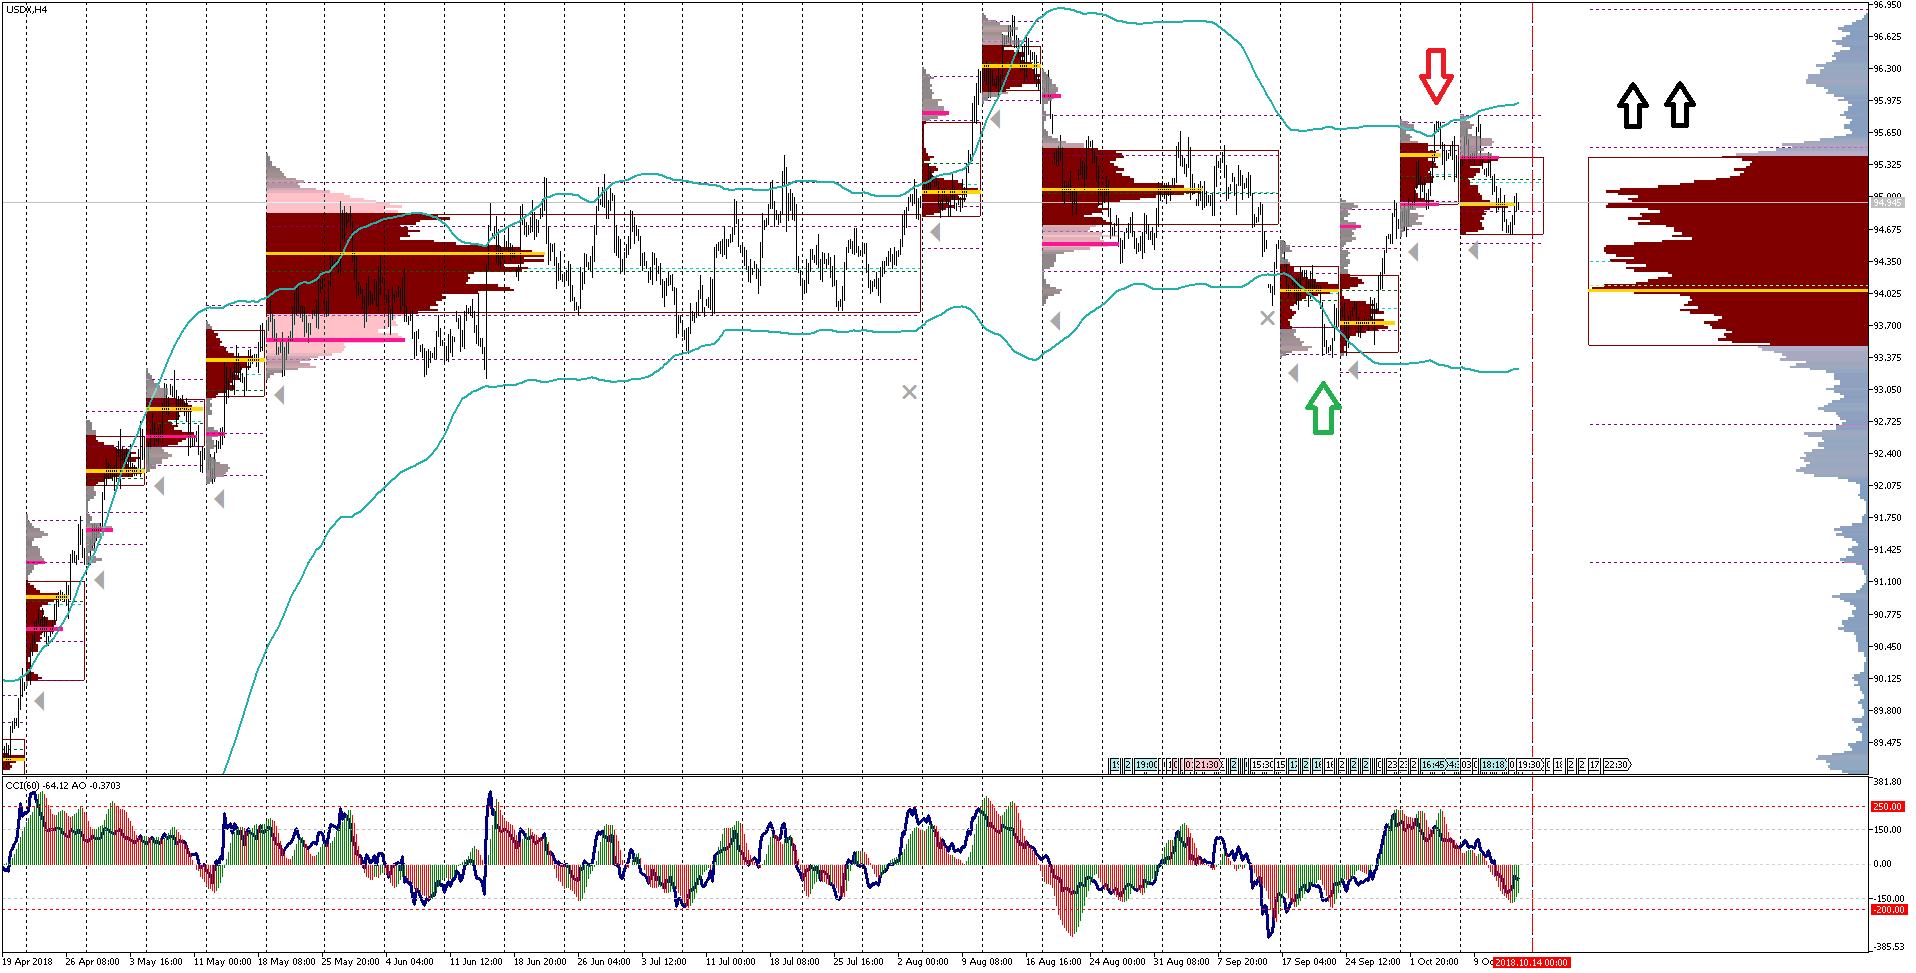
Towards, the end of September, we noticed the USDX consolidating at the bottom of the Value Area, around 93.40’s (green arrow) so structurally we were prepared for another bounce higher, at least at the Highs of the range.
Back then, again based on structure, the easiest trades where the EURUSD (sell it below 1.18) and the AUD (fading corrections).
The move worked and the USDX moved to the Highs of its range (red arrow). However, we noticed again technically that it was struggling to consolidate above the Value Area Highs and the sellers were more aggressive than buyers.
We were expecting a correction on the USD and due to Fundamentals reasons, we couldn’t see the US 10y yield running wildly higher.
Again, our two choices, to express our views based on structure, were the USDJPY and the EURUSD.
Personally, I had a much stronger conviction about the USDJPY because, I was very negative on equities and I was anticipating the JPY to strengthen on a potential risk off environment.
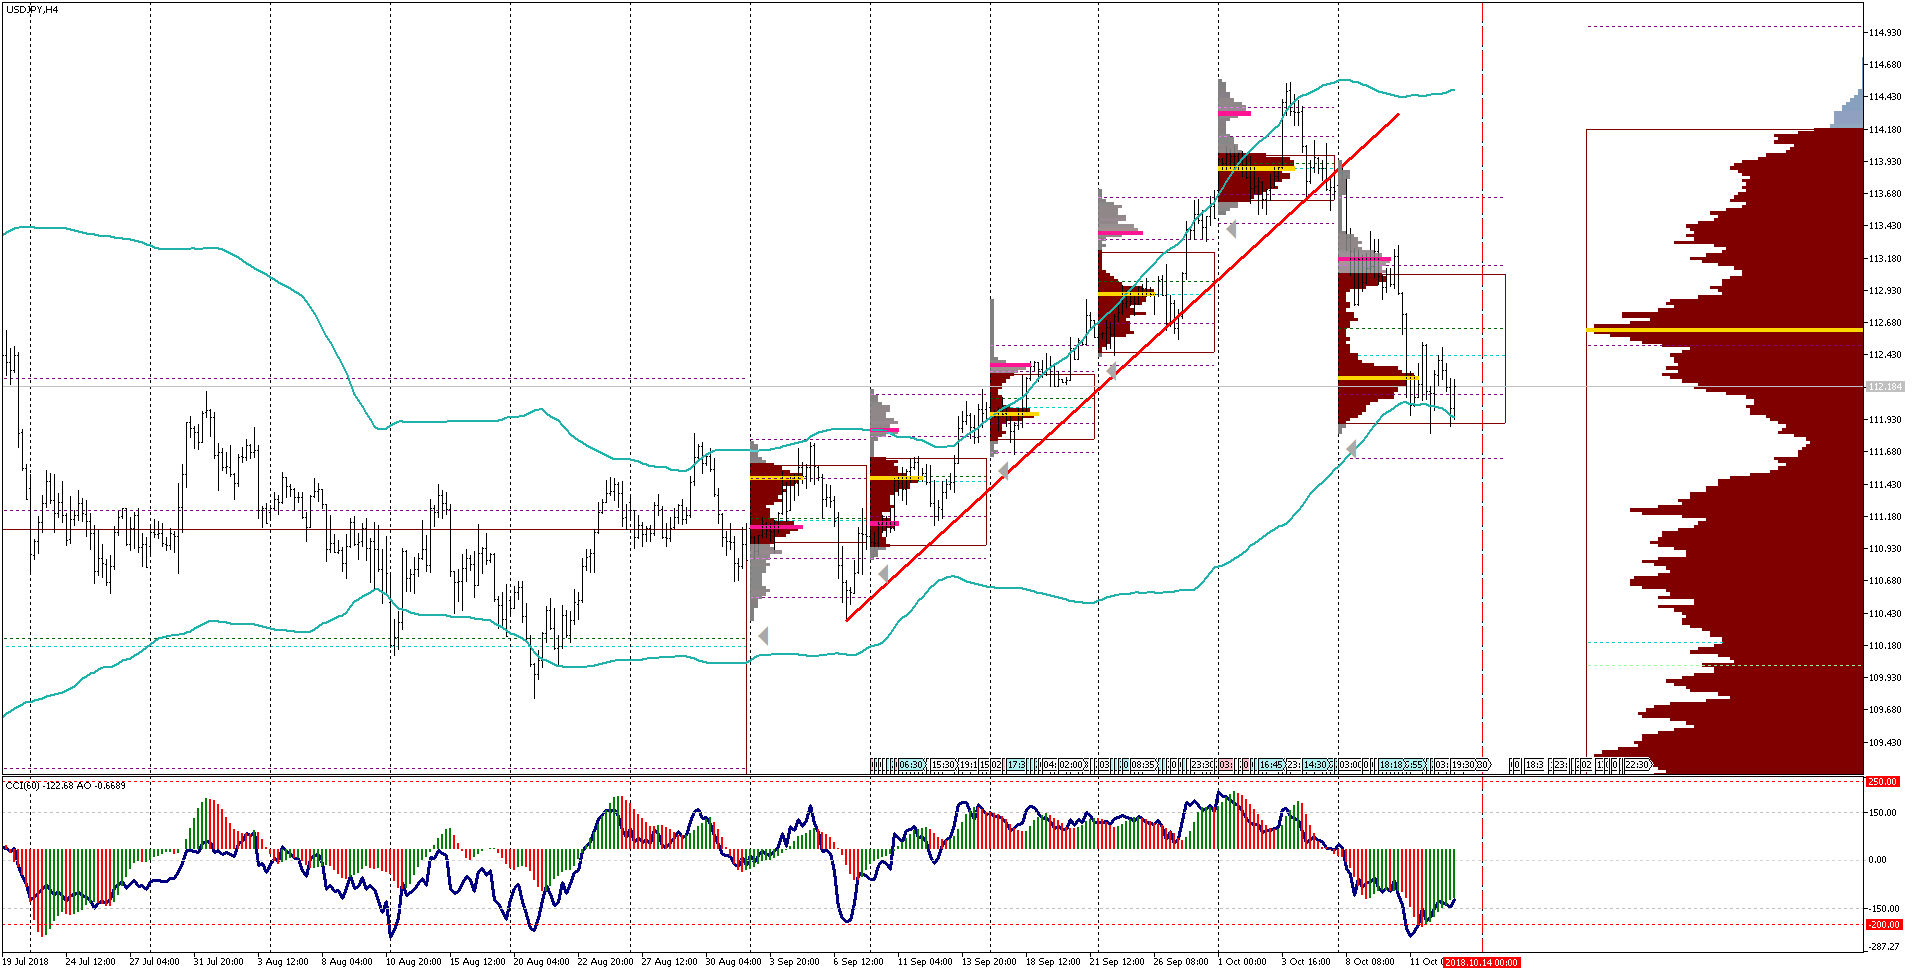
We were looking to sell the USDJPY below 113.68 at the break of the red trendline and thankfully this trade worked out.
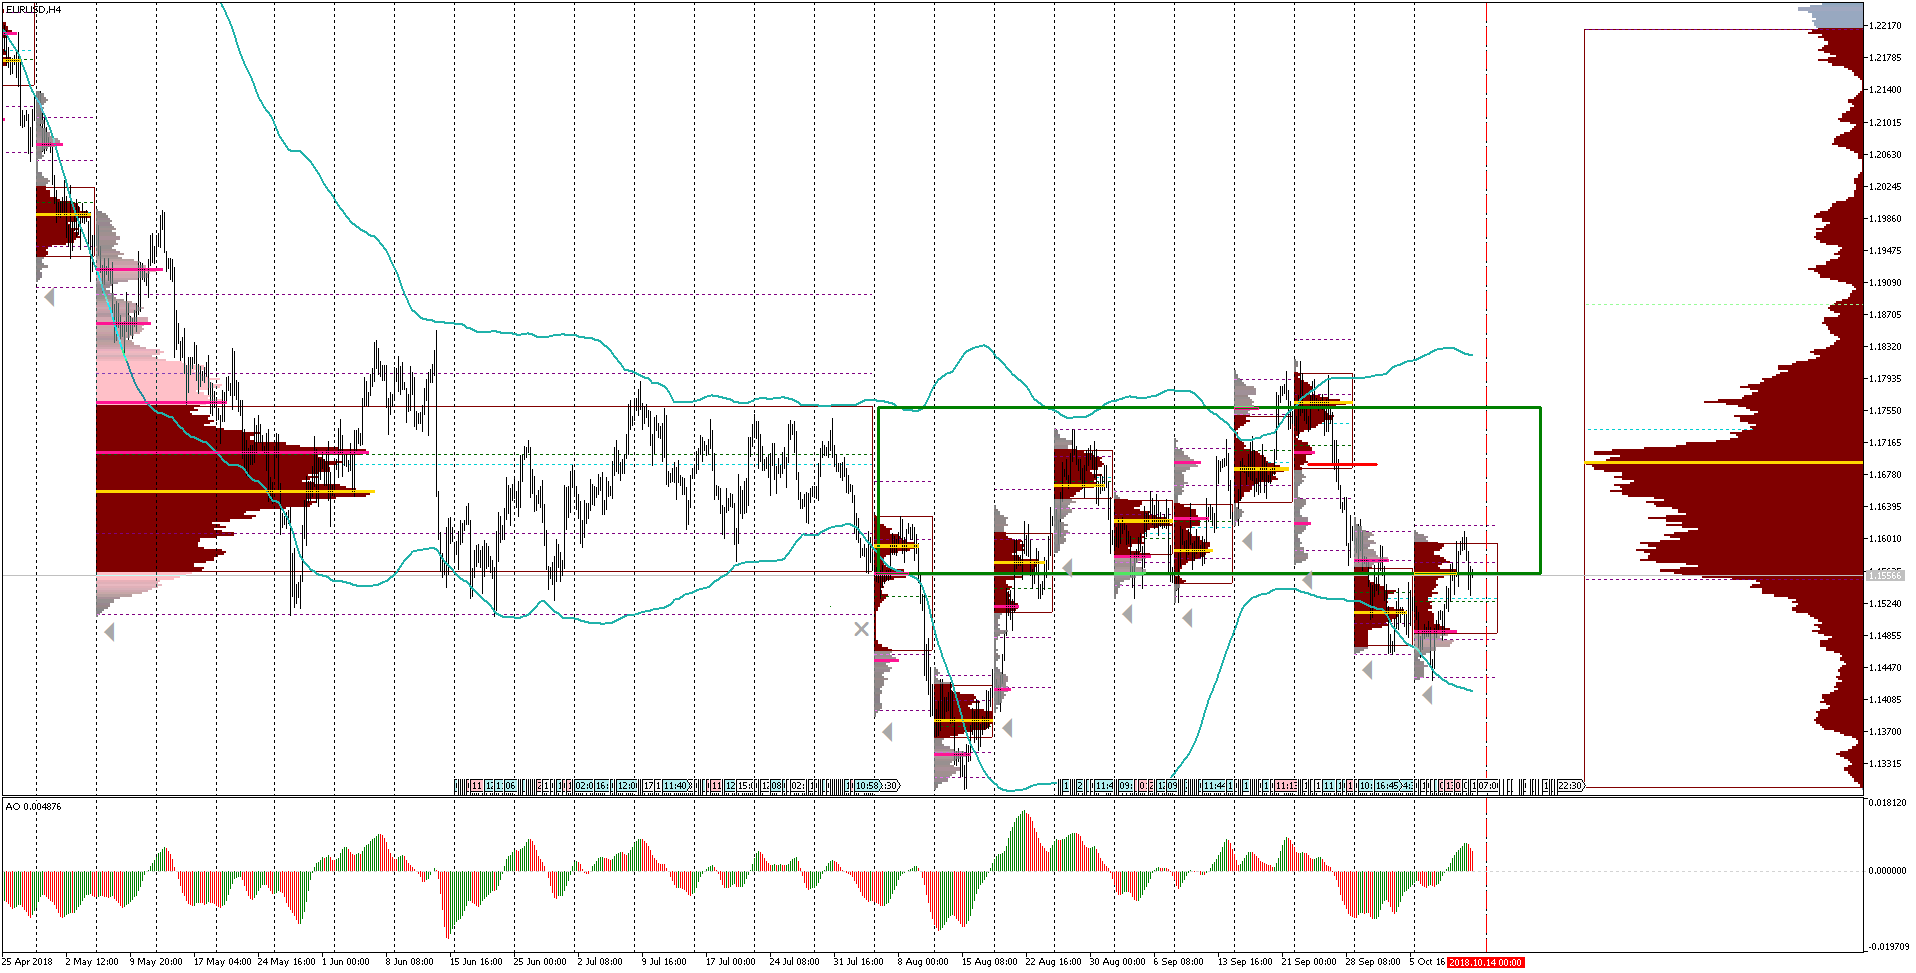
I didn’t have the strongest of the convictions about the EURUSD, however I could see the important support around 1.1450 where we had the 2nd Standard Deviation of the VWAP of the larger composite profile and indeed the buyers were interested to get active in this area.
Again, these two trades worked out because the intermarket relationships helped us as well.
The strong move down in equities, caused the JPY to strengthen and the EUR to appreciate as well, as it was acting like a safe-haven currency.
For the week, starting on the 15th of October, I do not have the same strong conviction I had before, and I see we have a decent probability of a sharp reversal higher in equities which will affect FX currencies too.
Please take a look at the 4H S&P500 in the chart below.
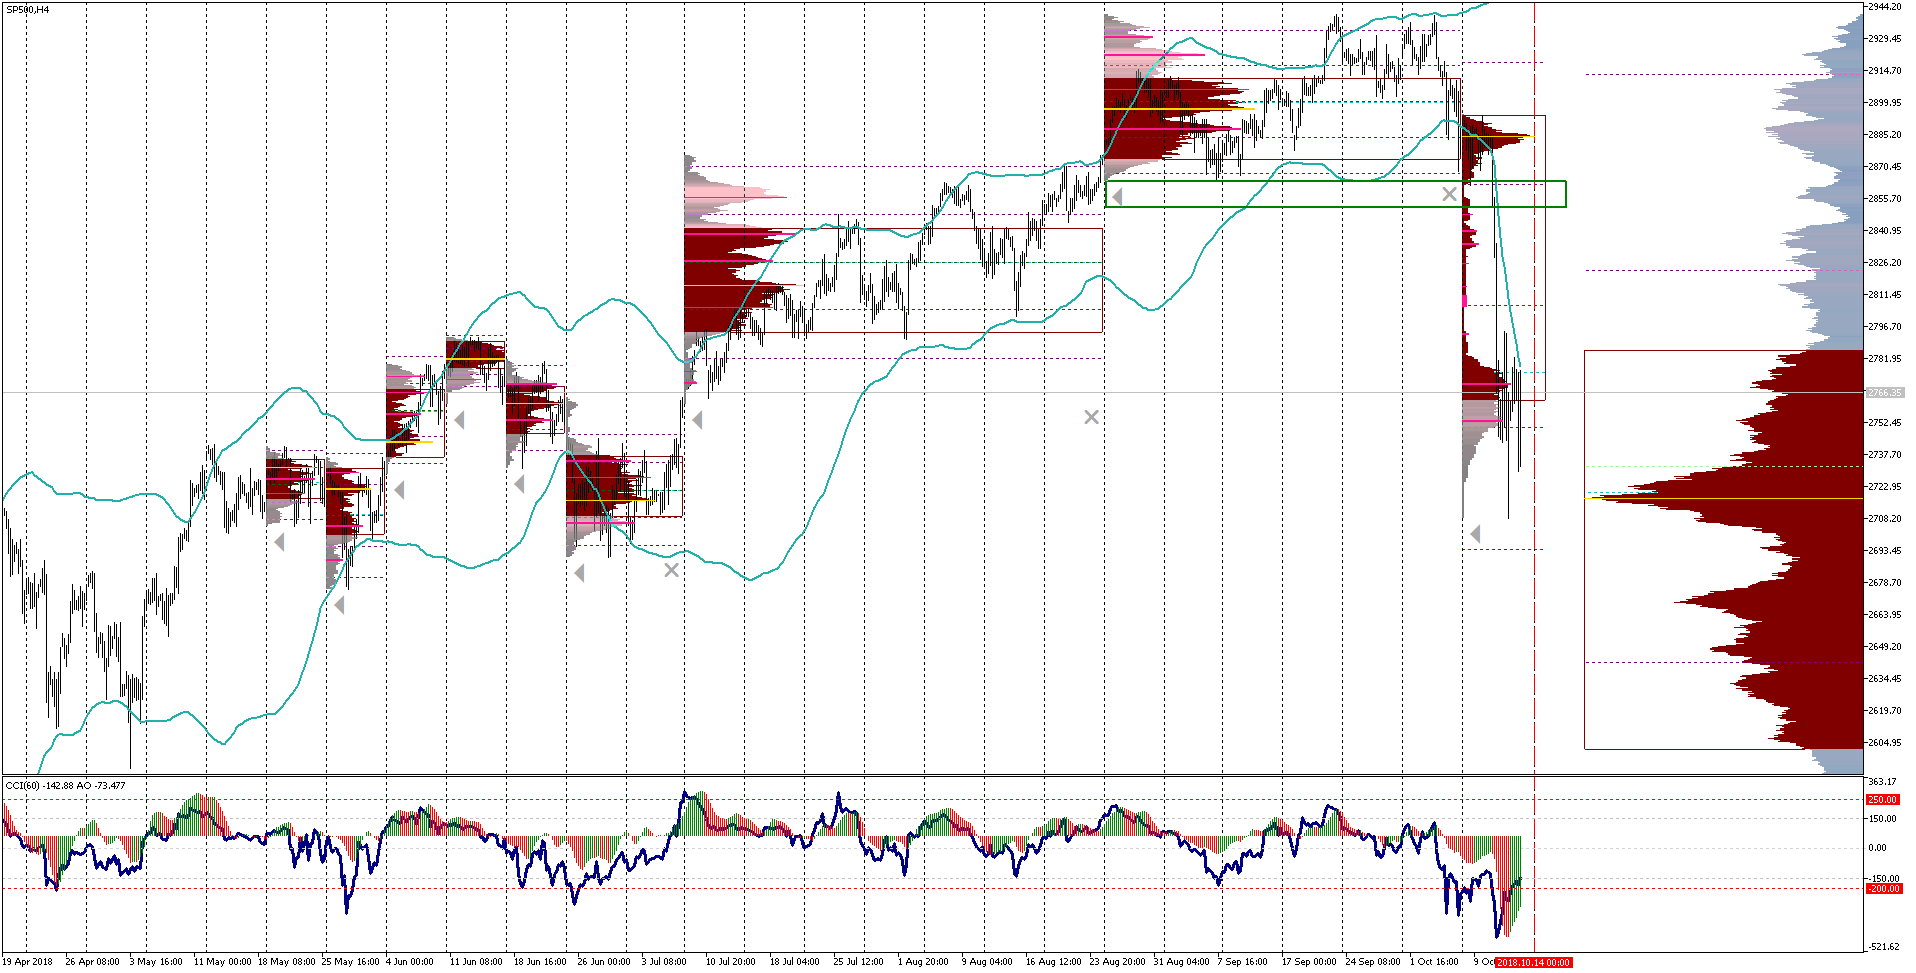
We were conservative sellers at the Highs below 2920 and we were taking partial profits into 2860. That was a very important level, as it was the bottom of the balance. We had issued an alert to watch for a break below that level and our first target was 2780.
But look where we are now, where is the low of the recent move. Right, into 2720 area where we have an important High-Volume Node and we also have the POC (Point of Control), the point with the highest volume (yellow horizontal line).
Let’s remain on the S&P500 but on a smaller timeframe.
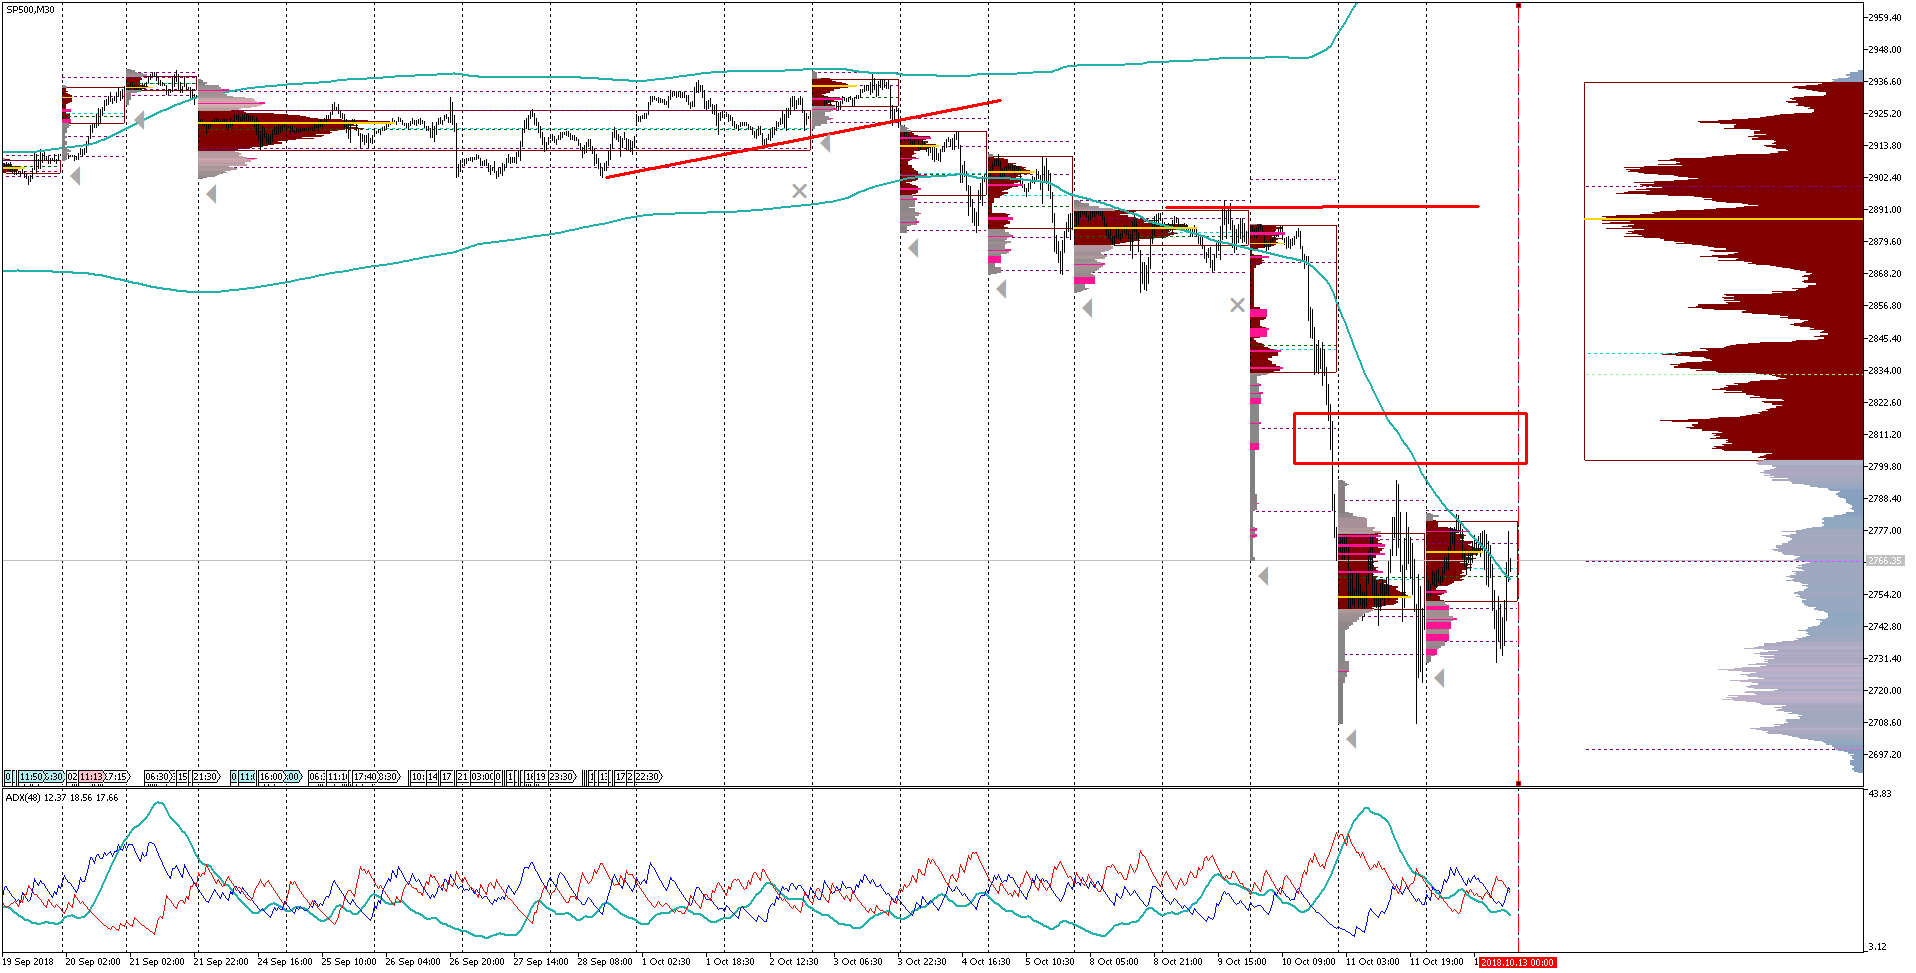
Look, how the nature of the move has changed from strong vertical down to horizontal ranging. I cannot rule out a break higher above 2780 and an attempt to test 2800 or 2890, even the Value Area High at 2936.
If that happens, how will the FX markets react?
Let’s go back to USDJPY again on a smaller timeframe.
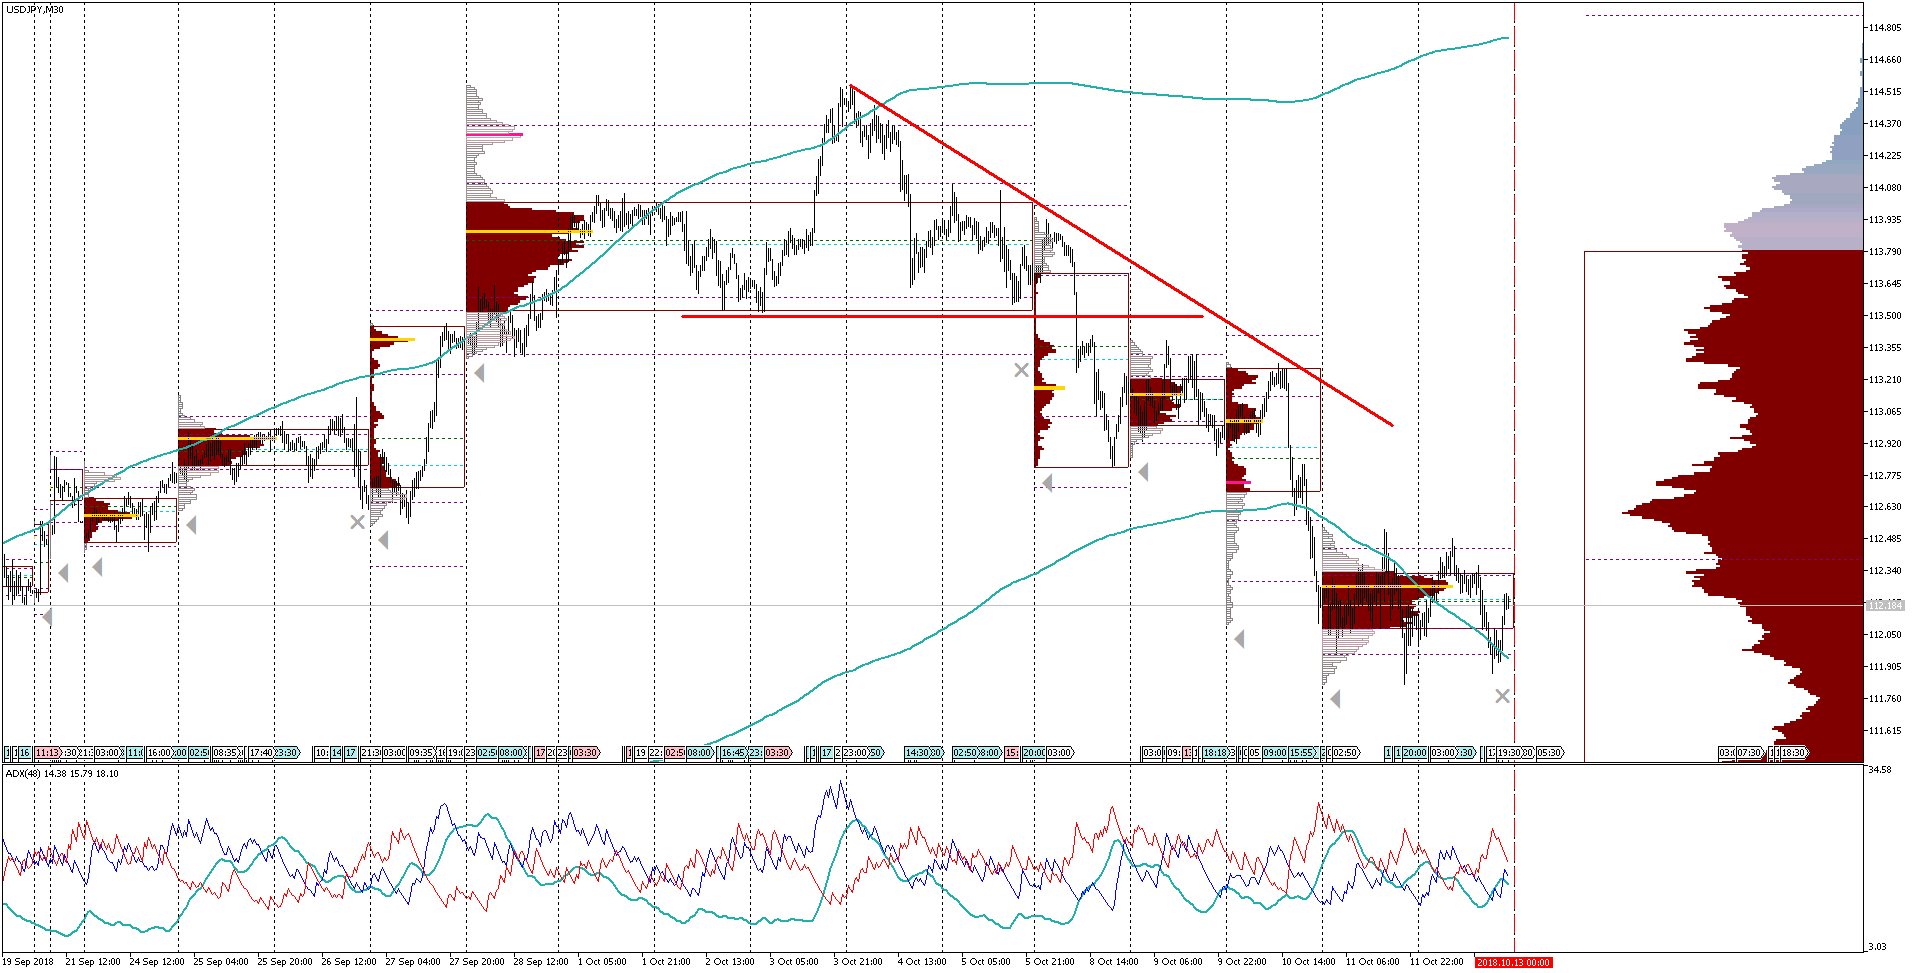
You can see that after the move lower, the USDJPY is consolidating, for the last couple of days, without making new lows, similarly to the S&P500. I will be looking for a move above 112.40 and I will try a small long position, targeting initially 113 and perhaps 113.80.
I will leave the EURUSD alone for the time being.
But I do like the EURJPY!
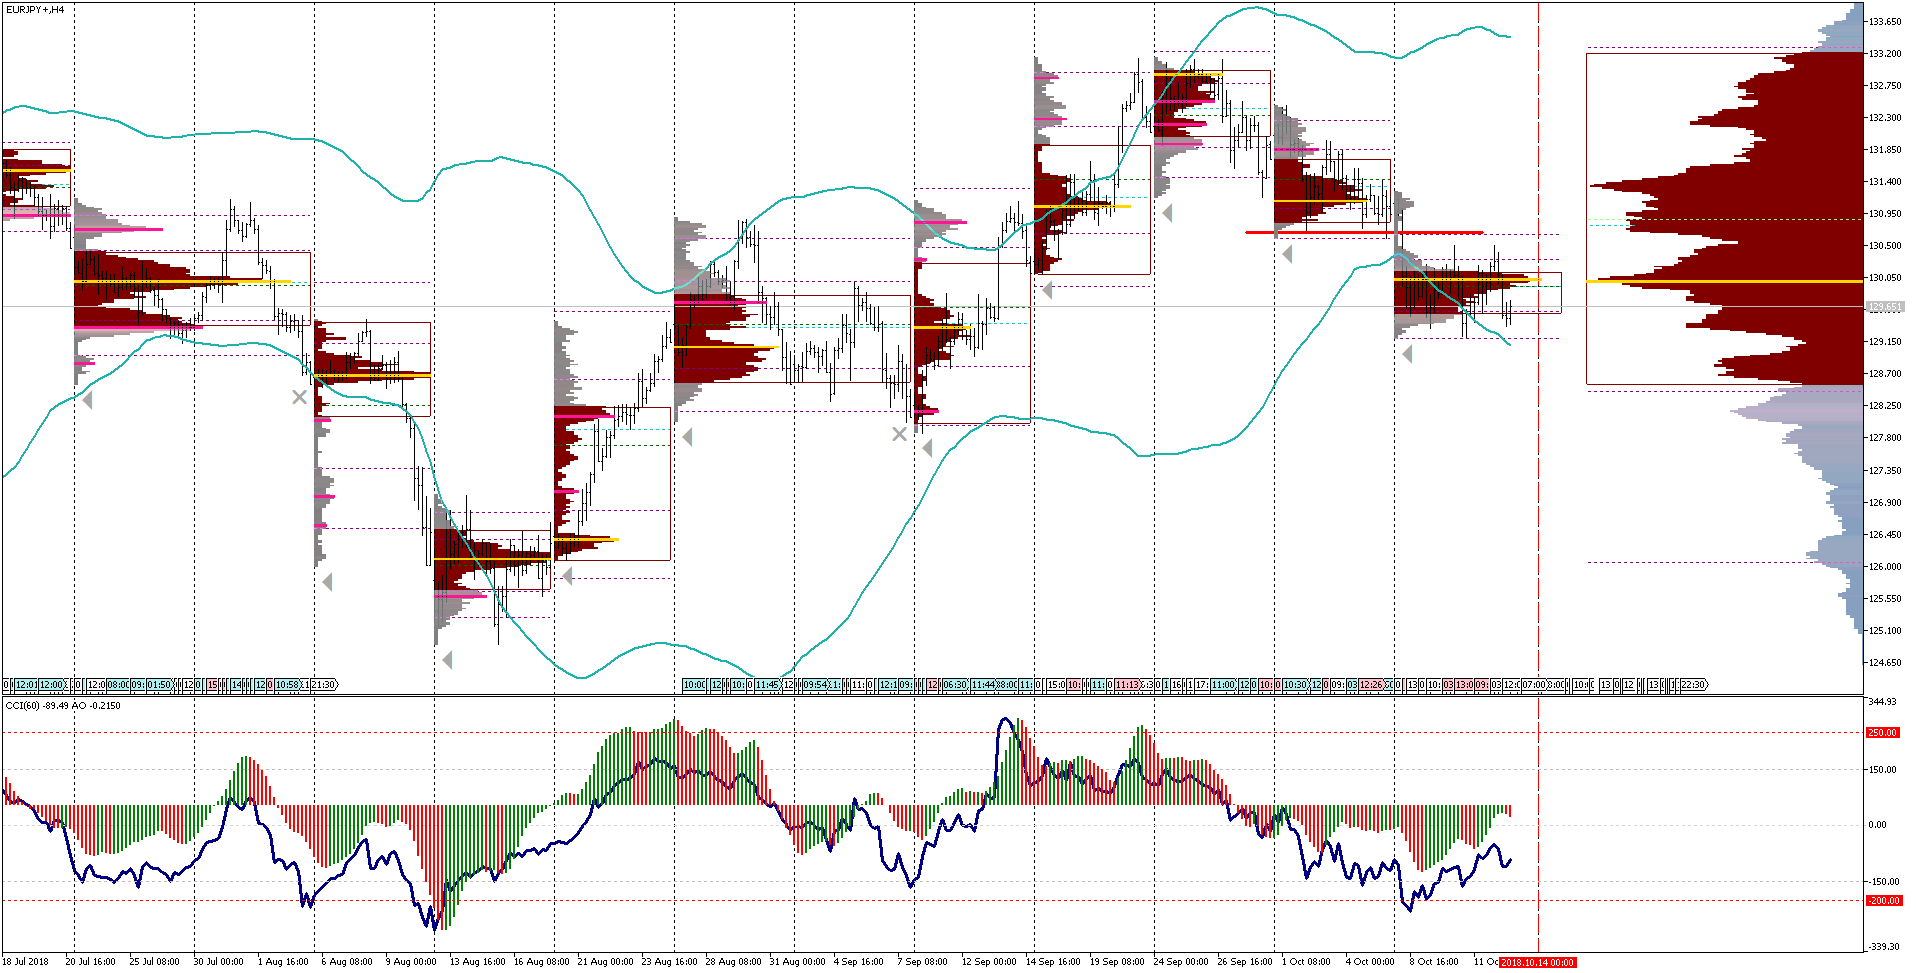
We had issued an alert to sell below 130.90 but right now I can see we have moved at the bottom of Value and we could get a bounce higher in equities this week. Therefore, I will be covering my shorts, taking profits and expecting again to sell at higher levels into resistance.
I am super bearish on Australia, due to the slowdown and deleveraging in the Chinese economy and the real estate bubble in certain Australian cities.
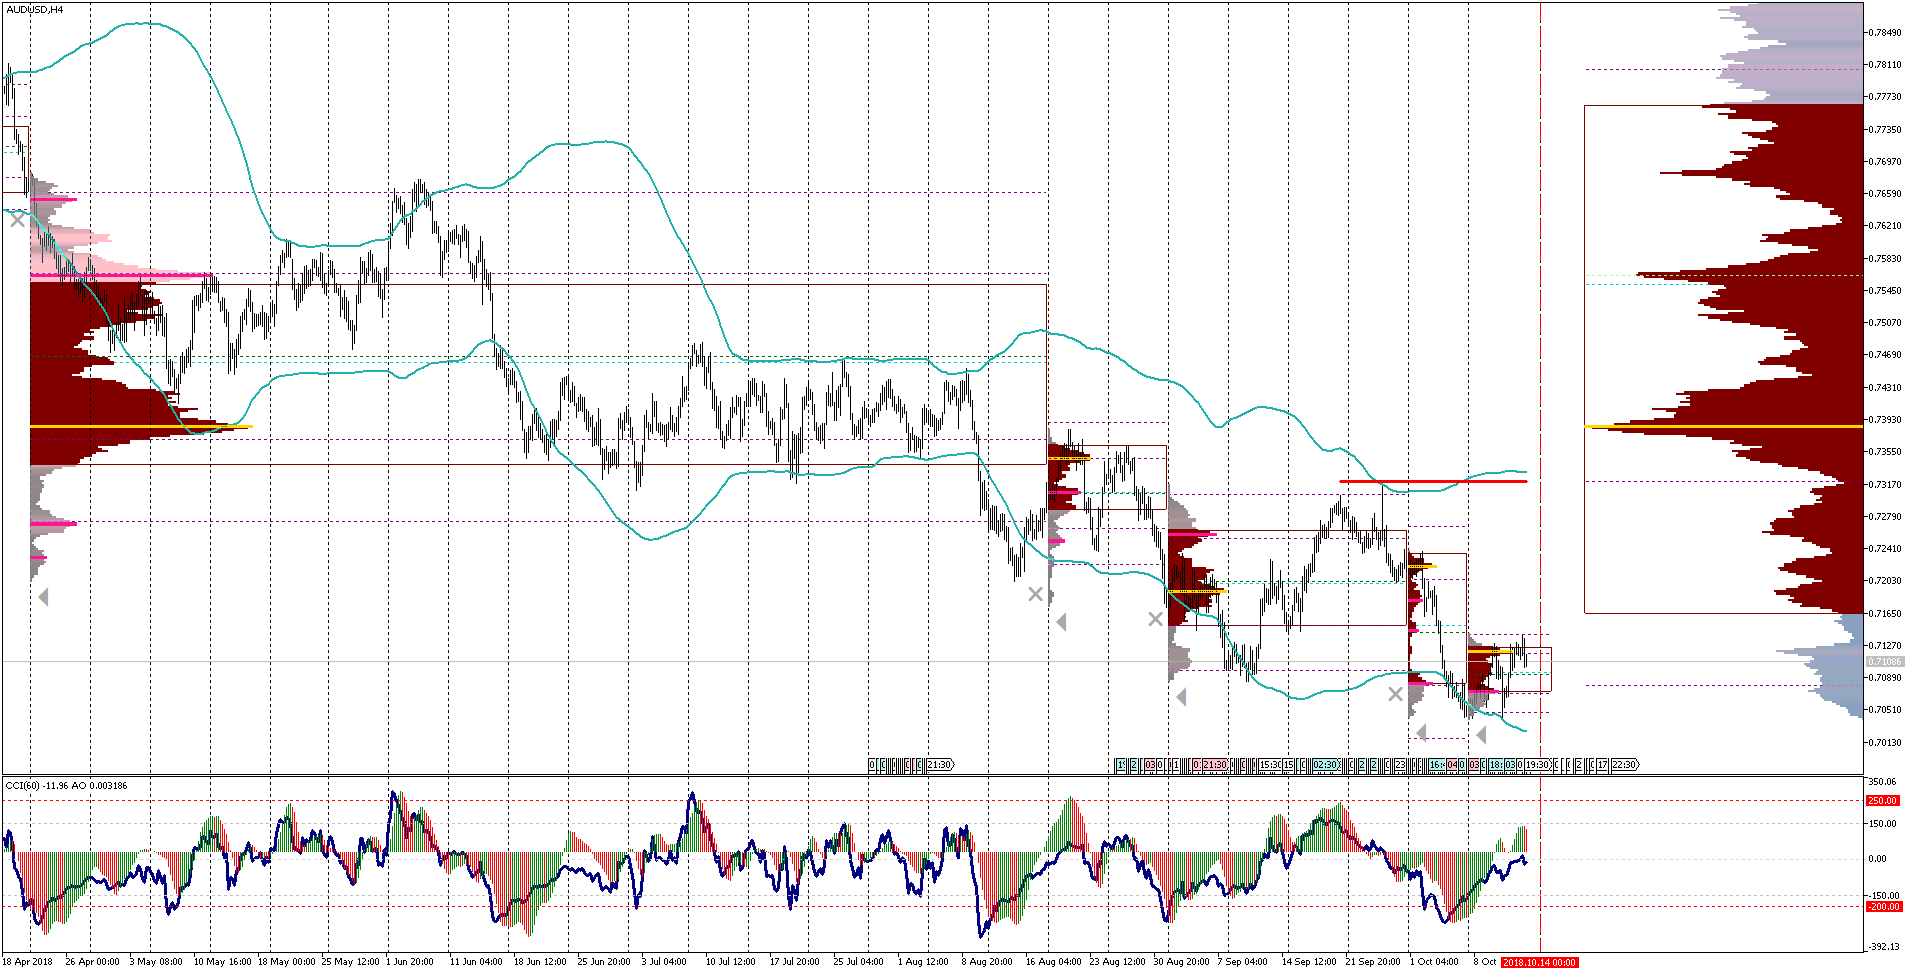
Looking at the structure I cannot rule out a correction higher in the Aussie, but my strategy is to sell again the AUD higher into resistance, up to 0.7230.
Now, let’s discuss Gold!
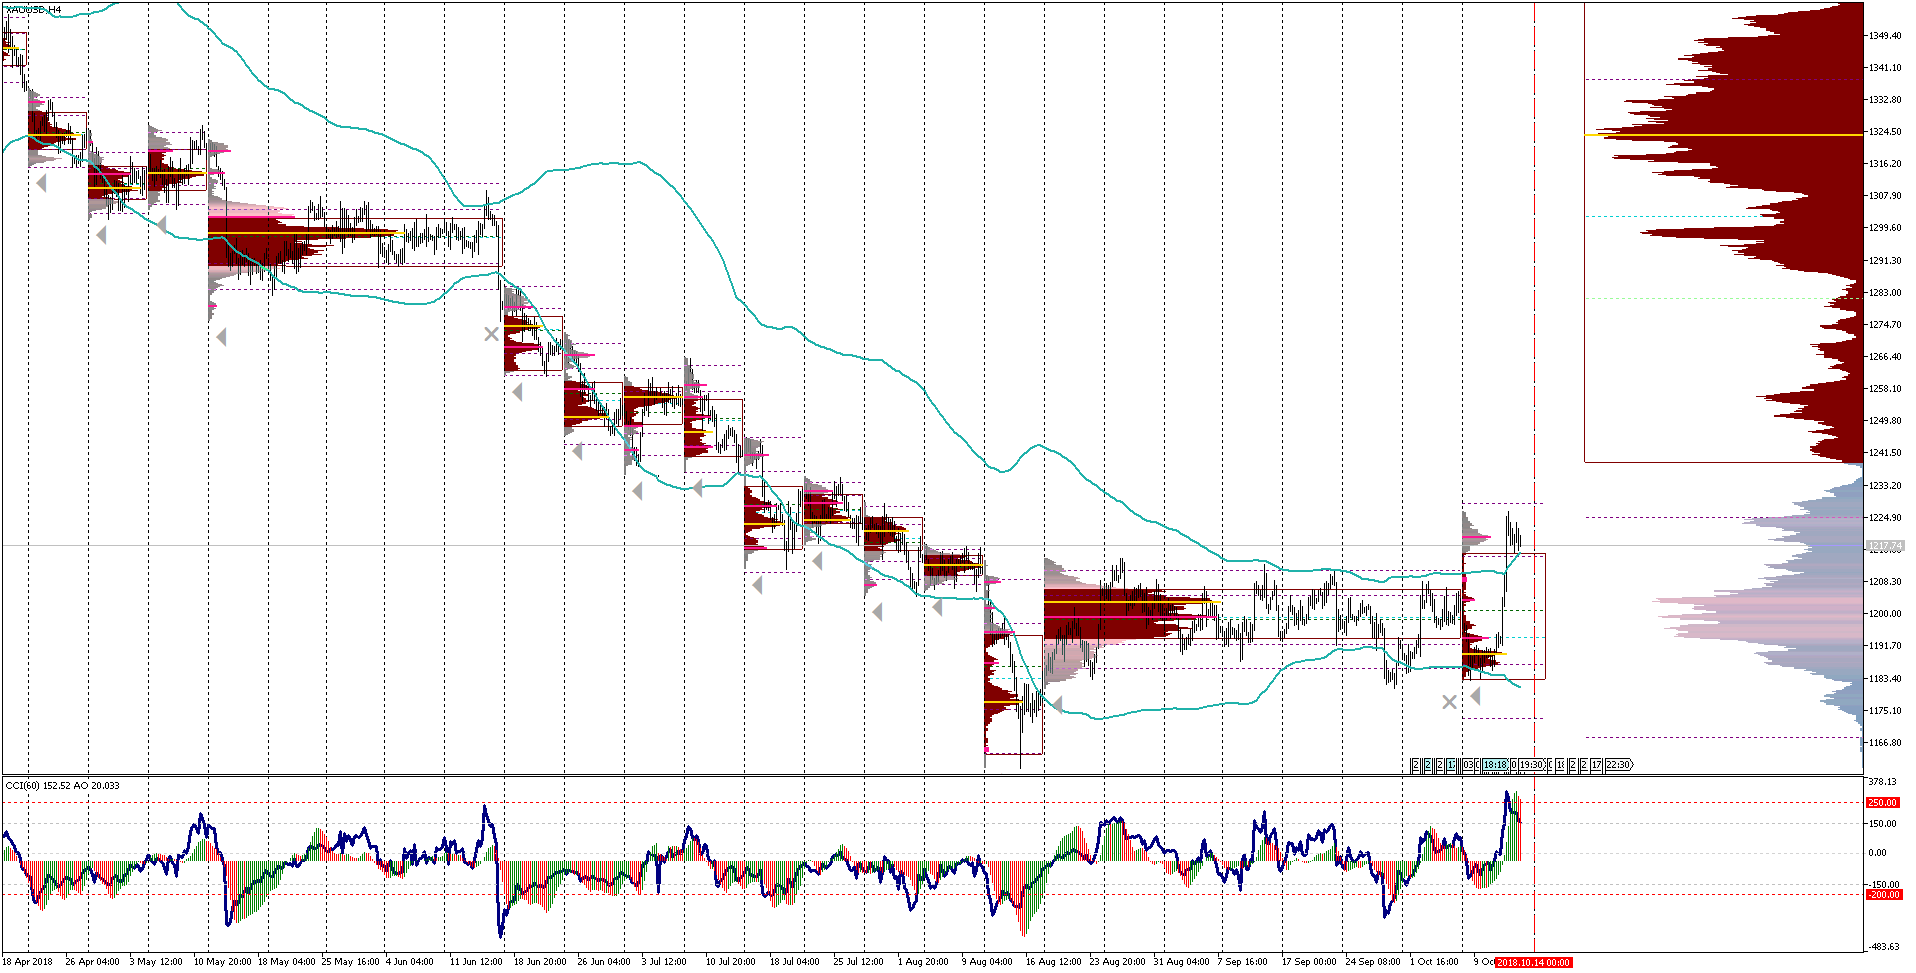
For the last few months, we had recommended, purely speculative speaking and just for the short term, to fade moves higher and it worked but, something has changed now.
You can see the important concentration of Volumes at the bottom and the strong move higher above the Value Area High at 1208. I will be looking to add Gold strategically and hold it for a longer period.
What you can take from our technical perspective on the markets is that we did have a Fundamental Outlook, based on macro-economic indicators but, before pulling a trade, we were paying great attention to the underlying technical structure and the potential reward/risk.
In an environment where volatility could rise significantly, and sentiment get out of control, focusing on structure and reward/risk could make a big difference in your trading performance.
Author

Fotis Papatheofanous, MBA
Fotis Trading Academy
Fotis, as you would expect from his name is the key trainer at the Fotis Trading Academy. Fotis is a highly reputed, driven and successful Global Macro Trader and Portfolio Manager.


