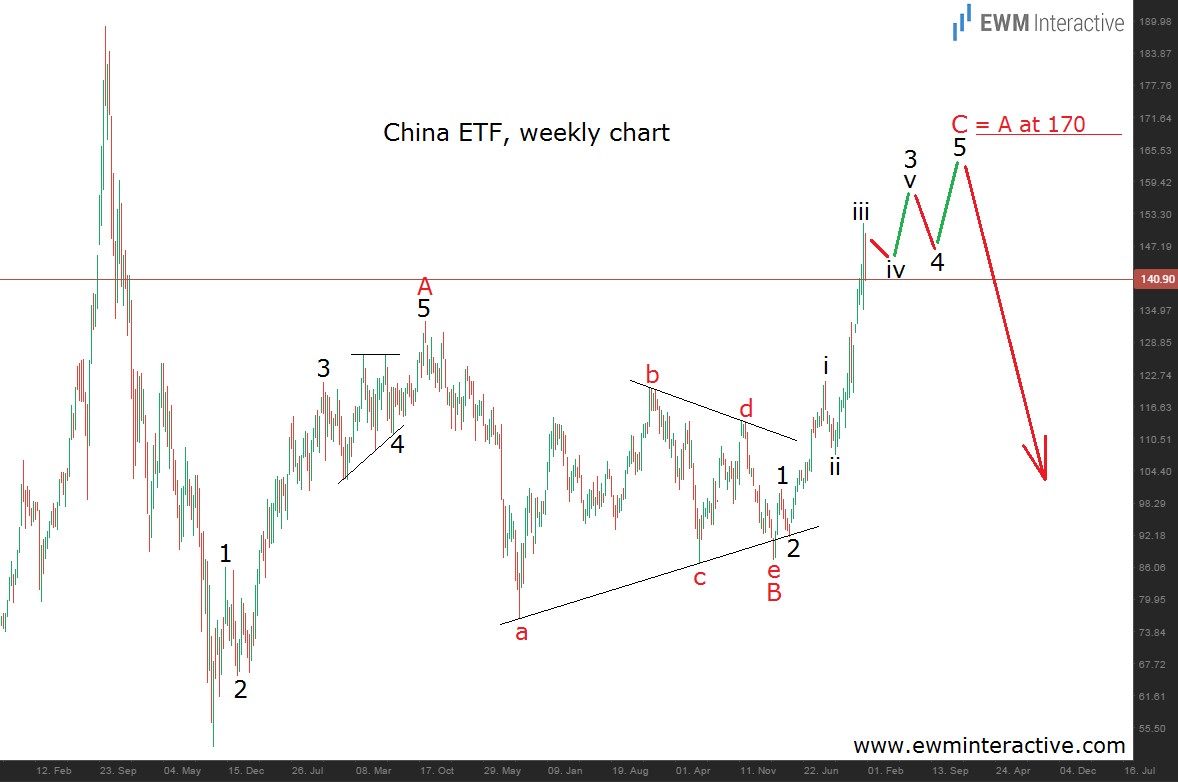
It’s been more than six years since the China Index ETF bottomed at 52.05 in October 2008. Now, in 2015, the index is looking far much better, trading around 140. Last week it even managed to climb to 151.50, which is a rally of almost 100 figures, compared to the 2008 lows. But is the rally here to stay? The Elliott Wave Principle suggests there are signs that the bulls might be running out of power soon. The chart below explains why.
The Wave Principle is a technical method of analysis. This means it relies on the information the market provides through the price charts. According to Elliotticians, the structure of the price action forms repetitive patterns, which make future swings predictable to a certain degree. The chart of the China ETF shows some easily recognizable patterns. As visible, there is a five-wave impulse, labeled with “A”. It begins from the 2008 bottom and ends at 133.00 in November 2010. The theory states, that every impulse is followed by a correction in the opposite direction. In this case, this correction is a wave B triangle. It is officially completed in March 2014, when the China ETF formed a bottom at 87.70. Triangles precede the last wave of the larger sequence. In our opinion, the last wave here is wave C to the upside, which is currently developing. Once it is finished, the larger A-B-C zig-zag pattern would be completed. Zig-zags are a type of correction. When the larger trend resumes, corrections are supposed to be fully retraced. This means that the end of wave C would mark the beginning of a new big decline, which should lead prices below the bottom of 2008. The question seems to be where the final top is most likely to form. Well, wave C does not look over yet. The wave structure suggests there is still some bullish power left. In addition, waves A and C tend towards equality. The price level, where they would reach it, is around 170. This is the area where the reversal is most likely to occur. If this is the correct count, future is not bright at all for the China ETF Index.
Recommended Content
Editors’ Picks
EUR/USD clings to gains above 1.0750 after US data

EUR/USD manages to hold in positive territory above 1.0750 despite retreating from the fresh multi-week high it set above 1.0800 earlier in the day. The US Dollar struggles to find demand following the weaker-than-expected NFP data.
GBP/USD declines below 1.2550 following NFP-inspired upsurge

GBP/USD struggles to preserve its bullish momentum and trades below 1.2550 in the American session. Earlier in the day, the disappointing April jobs report from the US triggered a USD selloff and allowed the pair to reach multi-week highs above 1.2600.
Gold struggles to hold above $2,300 despite falling US yields

Gold stays on the back foot below $2,300 in the American session on Friday. The benchmark 10-year US Treasury bond yield stays in negative territory below 4.6% after weak US data but the improving risk mood doesn't allow XAU/USD to gain traction.
Bitcoin Weekly Forecast: Should you buy BTC here? Premium

Bitcoin (BTC) price shows signs of a potential reversal but lacks confirmation, which has divided the investor community into two – those who are buying the dips and those who are expecting a further correction.
Week ahead – BoE and RBA decisions headline a calm week

Bank of England meets on Thursday, unlikely to signal rate cuts. Reserve Bank of Australia could maintain a higher-for-longer stance. Elsewhere, Bank of Japan releases summary of opinions.
