AUDUSD lost more than 500 pips since the beginning of July. “Should we expect a reversal or the decline is set to extend?” is what probably every trader is asking.
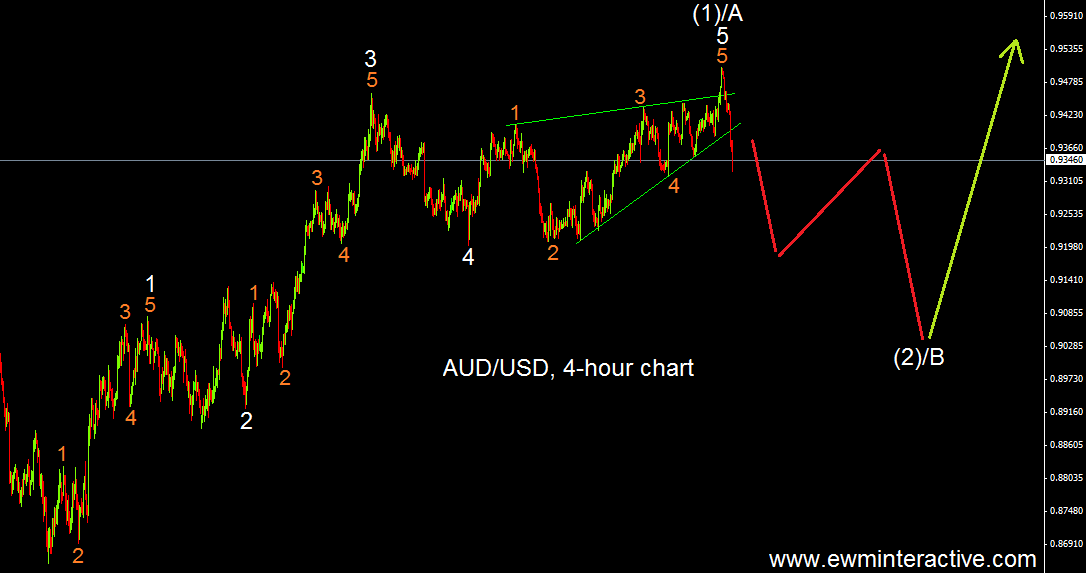
“If this is the correct count, the 0.91 zone could be revisited, before the uptrend resumes in wave (3/C).” It was 3rd July, when that forecast of AUDUSD was made with the pair trading around 0.9350 then. Two and a half months later it is time to see how the Australian dollar has been trading against the USD. But first we will show you the chart we used to make that prediction.
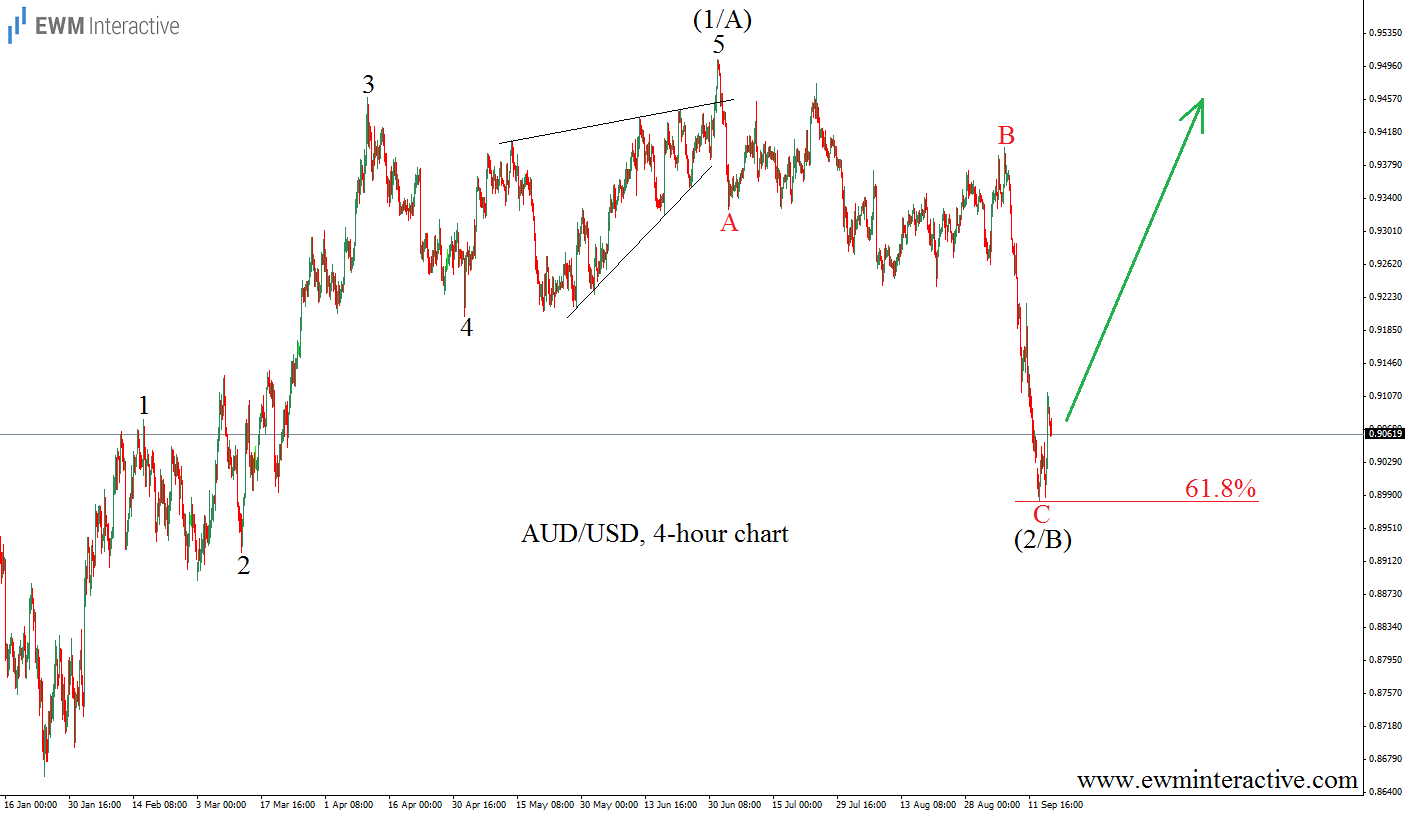
As always, our opinion was based on the Elliott Wave Principle. According to this method, after every five waves there should be a three-wave correction in the opposite direction. The chart of AUDUSD showed a complete five-wave sequence and that is why we were expecting a corrective decline. On the updated chart below you can see how the exchange rate has been developing ever since.
As visible, we were not bearish enough. AUDUSD fell to 0.91 as expected, but continued even lower to the 61.8% Fibonacci level at 0.8980. So, with five waves up and three waves down we have a textbook Elliott Wave bullish setup. If this is the correct count, we should prepare for stronger AUD, as long as the invalidation level of 0.8657 holds.
Trading financial instruments entails a great degree of uncertainty and a variety of risks. EMW Interactive’s materials and market analysis are provided for educational purposes only. As such, their main purpose is to illustrate how the Elliott Wave Principle can be applied to predict movements in the financial markets. As a perfectly accurate method for technical analysis does not exist, the Elliott Wave Principle is also not flawless. As a result, the company does not take any responsibility for the potential losses our end-user might incur. Simply, any decision to trade or invest, based on the information from this website, is at your own risk.
Recommended Content
Editors’ Picks
EUR/USD trades above 1.0700 after EU inflation data

EUR/USD regained its traction and climbed above 1.0700 in the European session. Eurostat reported that the annual Core HICP inflation edged lower to 2.7% in April from 2.9% in March. This reading came in above the market expectation of 2.6% and supported the Euro.
GBP/USD recovers to 1.2550 despite US Dollar strength

GBP/USD is recovering losses to trade near 1.2550 in the European session on Tuesday. The pair rebounds despite a cautious risk tone and broad US Dollar strength. The focus now stays on the mid-tier US data amid a data-light UK docket.
Gold price remains depressed near $2,320 amid stronger USD, ahead of US macro data

Gold price (XAU/USD) remains depressed heading into the European session on Tuesday and is currently placed near the lower end of its daily range, just above the $2,320 level.
XRP hovers above $0.51 as Ripple motion to strike new expert materials receives SEC response

Ripple (XRP) trades broadly sideways on Tuesday after closing above $0.51 on Monday as the payment firm’s legal battle against the US Securities and Exchange Commission (SEC) persists.
Mixed earnings for Europe as battle against inflation in UK takes step forward

Corporate updates are dominating this morning after HSBC’s earnings report contained the surprise news that its CEO is stepping down after 5 years in the job. However, HSBC’s share price is rising this morning and is higher by nearly 2%.

