NEO Elliott Wave technical analysis [Video]
![NEO Elliott Wave technical analysis [Video]](https://editorial.fxstreet.com/images/Markets/Currencies/Cryptocurrencies/Coins/NEO/neo.jpg)
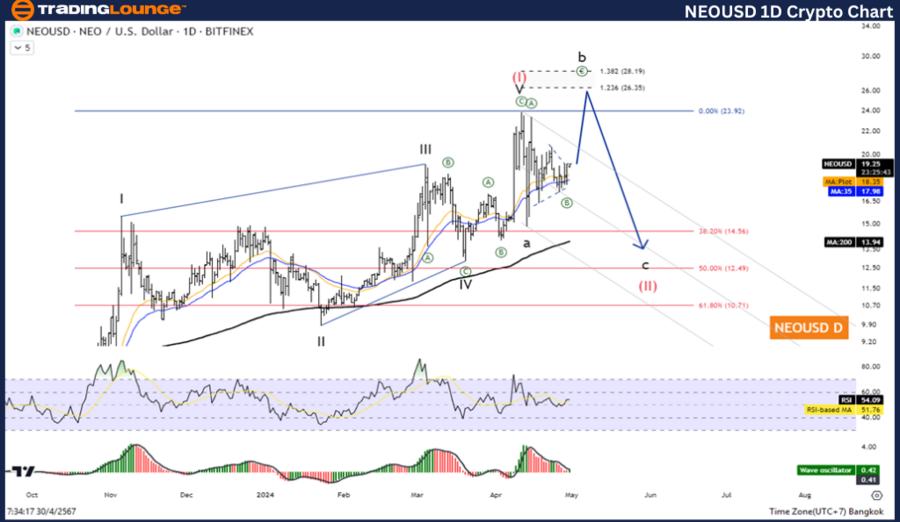
Elliott Wave Analysis TradingLounge Daily Chart
NEO/ U.S. dollar (NEOUSD)
NEO/USD Elliott Wave technical analysis
Function: Counter Trend.
Mode: Corrective.
Structure: Flat.
Position: Wave B.
Direction next higher degrees: Wave (II) of Impulse.
Wave cancel invalid level: 9.85.
Details: Wave (II) is equal to 61.8% of Wave (I) at 10.71 Level.
NEO/ U.S. dollar(NEOUSD)Trading Strategy: Second wave correction before rising again in the third wave with a flat pattern. The current status is a short-term pullback in wave B before falling again in wave C, so wait for the correction to complete to join the uptrend again.
NEO/ U.S. dollar(NEOUSD)Technical Indicators: The price is above the MA200 indicating an Uptrend, The Wave Oscillator is a Bullish Momentum.
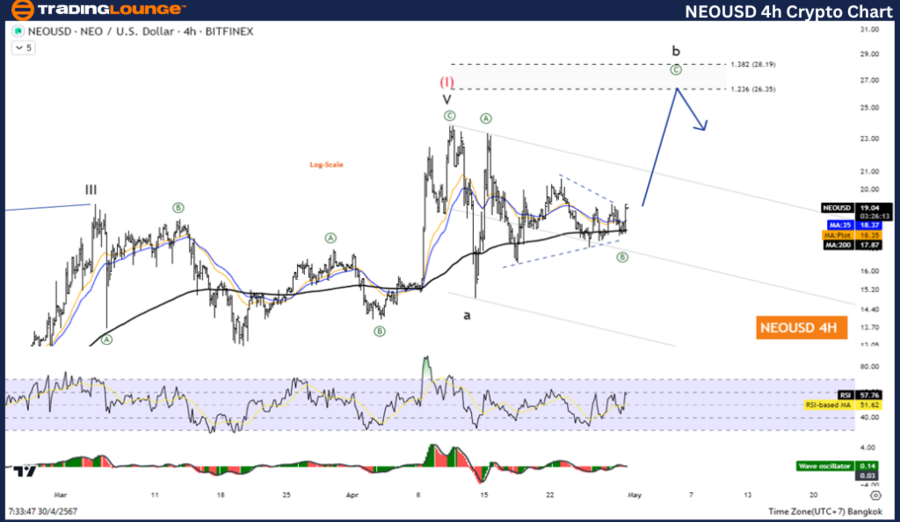
NEO/USD Elliott Wave analysis four-hour chart
Function: Counter Trend.
Mode: Corrective.
Structure: Flat.
Position: Wave B.
Direction next higher degrees: Wave (II) of Impulse.
Wave cancel invalid level: 9.85.
Details: Wave (II) is equal to 61.8% of Wave (I) at 10.71 Level.
NEO/ U.S. dollar(NEOUSD)Trading Strategy: Second wave correction before rising again in the third wave with a flat pattern. The current status is a short-term pullback in wave B before falling again in wave C, so wait for the correction to complete to join the uptrend again.
NEO/ U.S. dollar(NEOUSD)Technical Indicators: The price is above the MA200 indicating an uptrend, The Wave Oscillator is a Bullish Momentum.
NEO Elliott Wave technical analysis [Video]
Author

Peter Mathers
TradingLounge
Peter Mathers started actively trading in 1982. He began his career at Hoei and Shoin, a Japanese futures trading company.


