SP500 "1st Eclipse coming up"

SP500
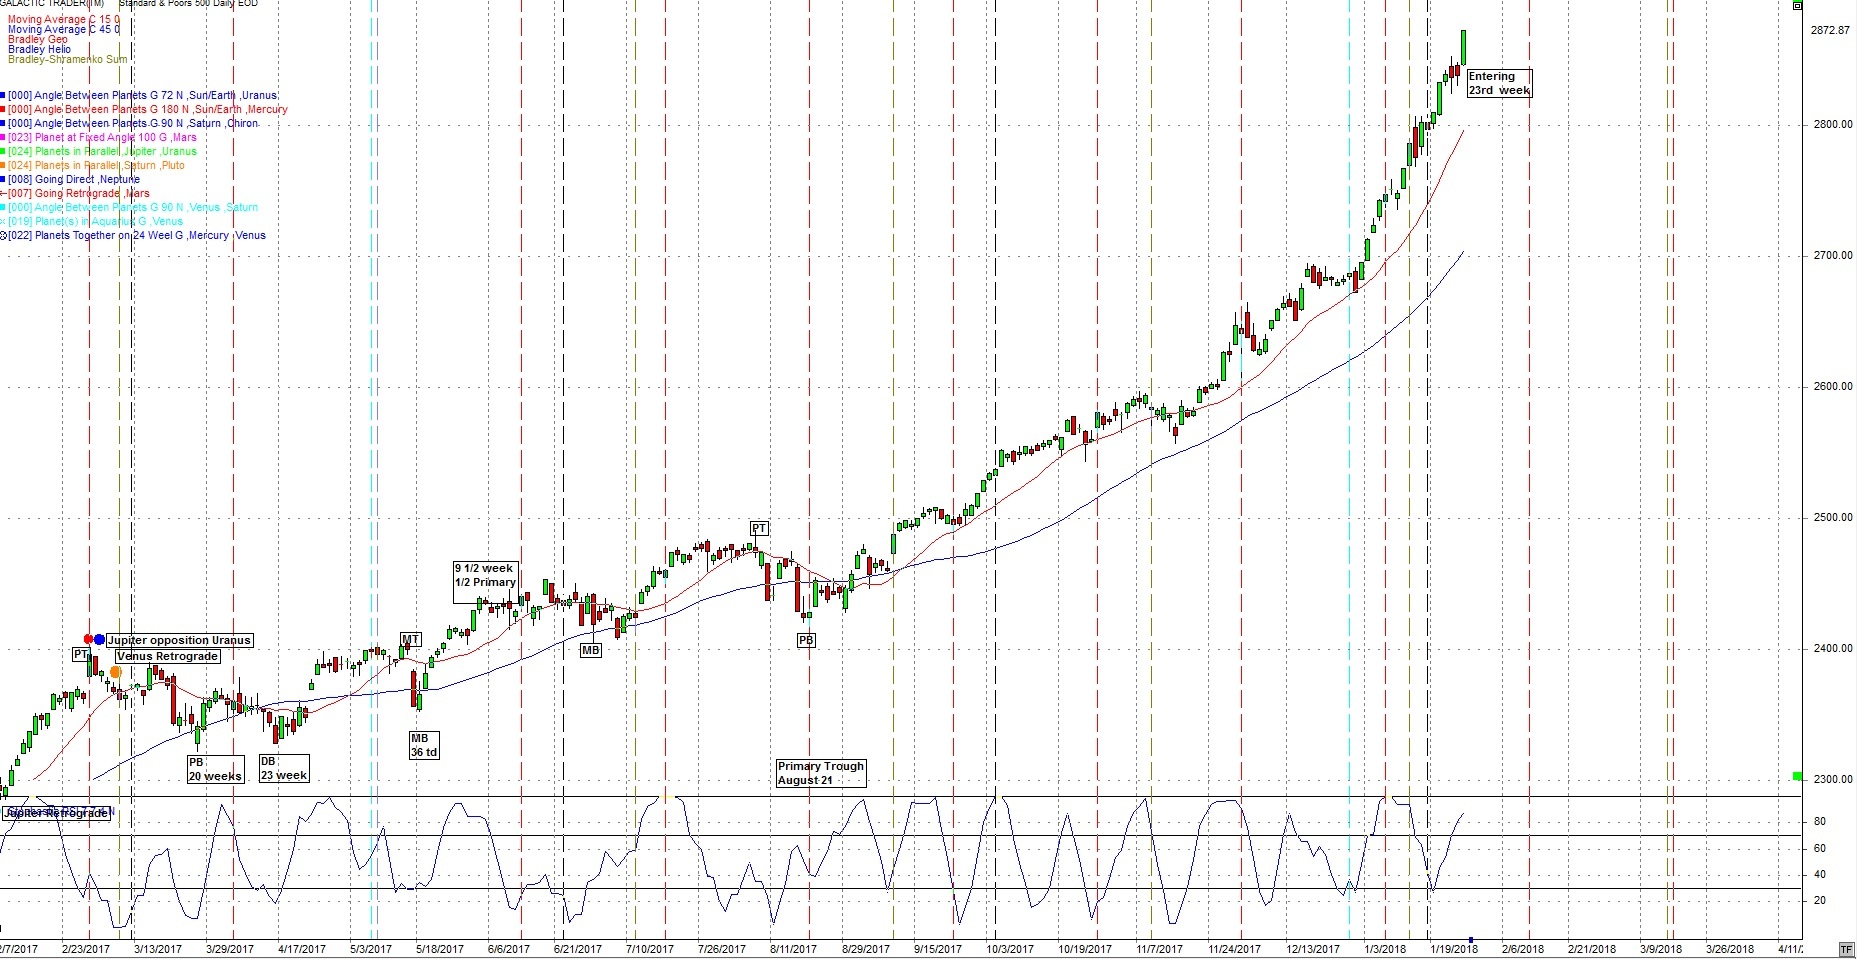
The last Primary cycle low was August 21st, the day of the Total Solar Eclipse. The standard for the Primary cycle is 18 weeks. We are now starting the 23rd week of the SP500 Primary cycle which has a range from 15 to 23 weeks. This has been an unusual time with the general market indices seemingly unstoppable.
Some of the cycles that are coming due are:
- The Primary Cycle (nominal 18 week)
- 9 month cycle
- 5 week.
These are all coming due. See the charts below
The Primary Cycles
There is a possible change in trends near Jan 31, the week starting February 4th and February 15. I’m not trying to identify a crash just a pull back which may be deep but short lived.
Jan 31 is the Total Lunar Eclipse. The Sun is at 11’Aquarius37” and the Moon at 11’Leo37. The Moon is also conjunct Ceres. This is also a Super Moon where the Moon is at it’s closest pass to the Sun this month. We could see violent weather or possible geophysical event close to this eclipse. Ceres has a mothering influence. This Lunar eclipse is in fixed signs, Aquarius and Leo. Situations and emotions are brought to light as the Moon illuminates the Earth exposing situations and events we have not seen before. There may be some surprises closer to the January 31, 2018 date.
The week of Feb 4 has Pluto conjunct the heliocentric nodes of Pluto which should give Pluto more power. This moves very slowly. The last time it occurred was Feb 20, 1772 just before 1776.
February 15 is a Solar eclipse. This may be made more powerful as it opposes the August 21, 2017 Solar Eclipse. That was followed by increased violence and very strong storms. This Solar eclipse will oppose Mars in the chart of Trump, Netanyahu and Israel. Watch for problems here. Further on Trump transiting Saturn in the 5th will soon be opposing his natal Mercury which is conjunct transiting Hades, a Uranian point, and a mean one. Trump’s problem continue as Saturn will be squaring his 2nd house Neptune. Illusion and delusion.
The 9 month cycle
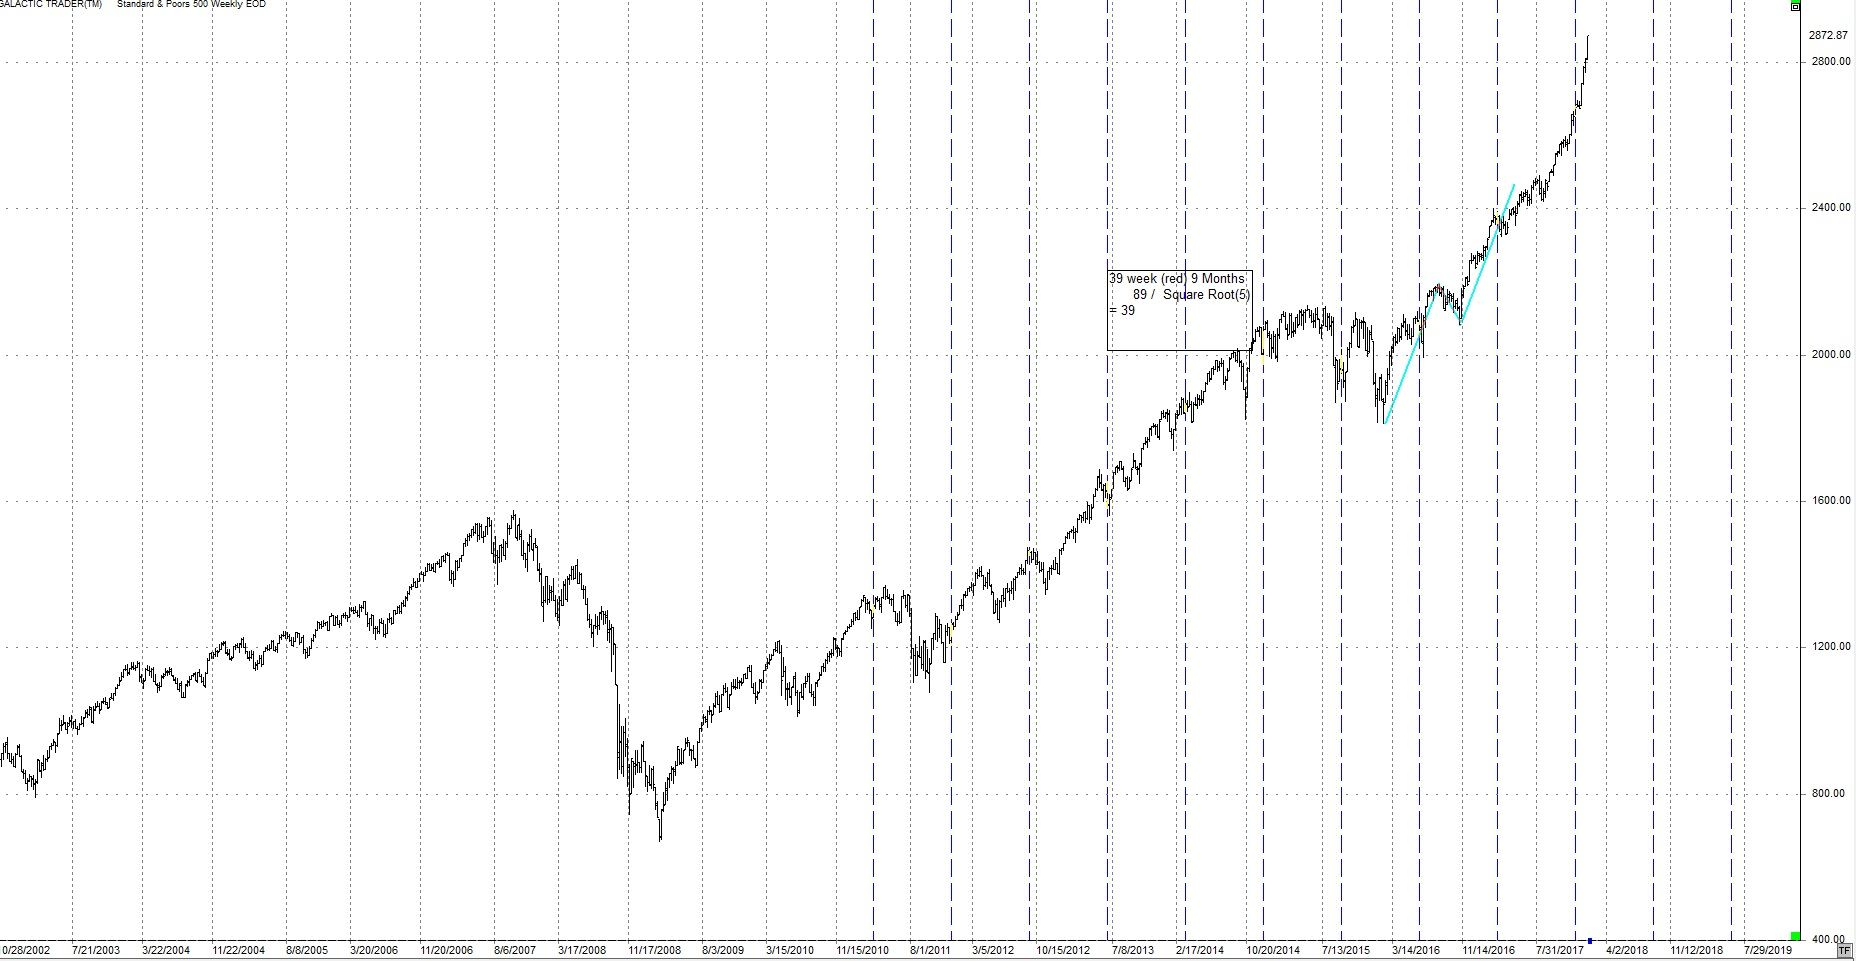
The above chart shows the 9 month or 39 week cycle (blue vertical lines). It is due and it is late. That seems to be the usual way these days.
The 3.8 – 4Year
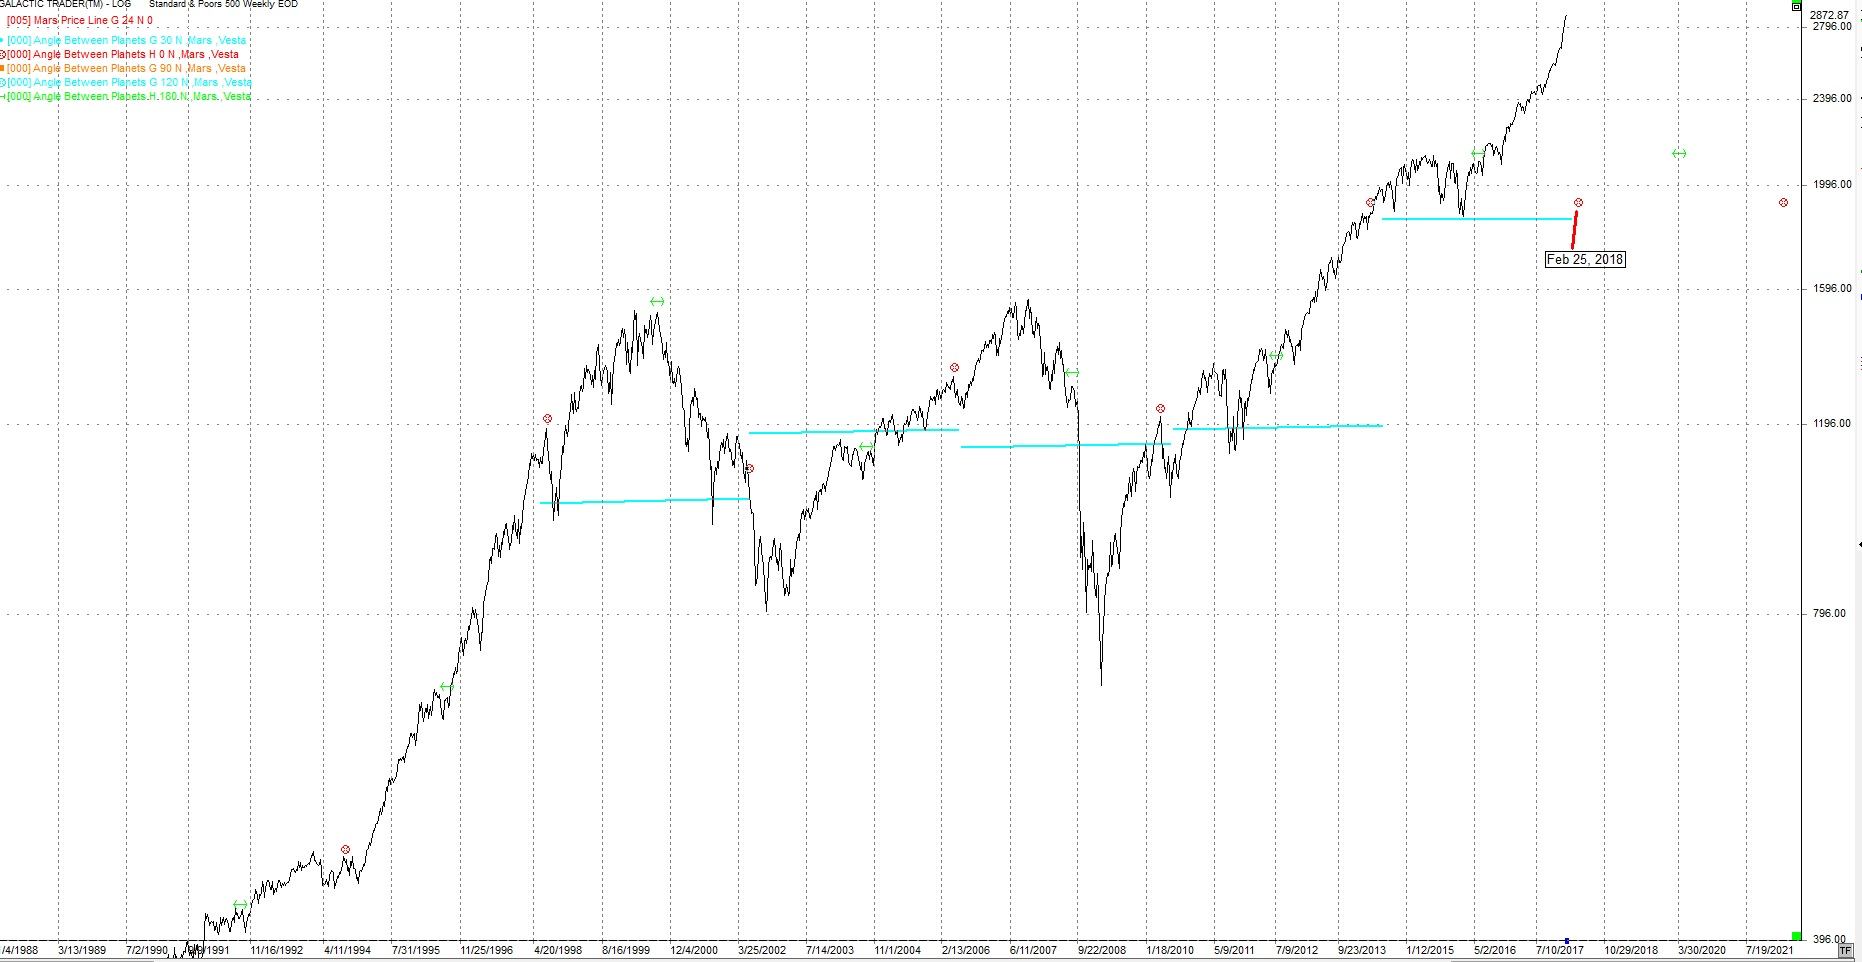
The above weekly chart of the SP500 shows the synodic cycle for Mars and Vesta. The red circles are the conjunction of the two and the green double arrows are the middle of the cycle. These are the heliocentric aspects.
Note how the conjunction is often at a top with a quick decline. The next Mars / Vesta conjunction is Feb 5, 2018.
From the last few posts:
“This coming year could see an increase in geophysical activity, both earthquakes and volcanos.”
Following are the significant earthquakes (> 6.0) so far in January 2018.
Jan 23 Alaska 7.9
Jan 10 Honduras 7.5
Jan 14 Peru 7.1
Jan 19 Mexico 6.3
Jan 21 Chile 6.3
Jan 25 Russia 6.2
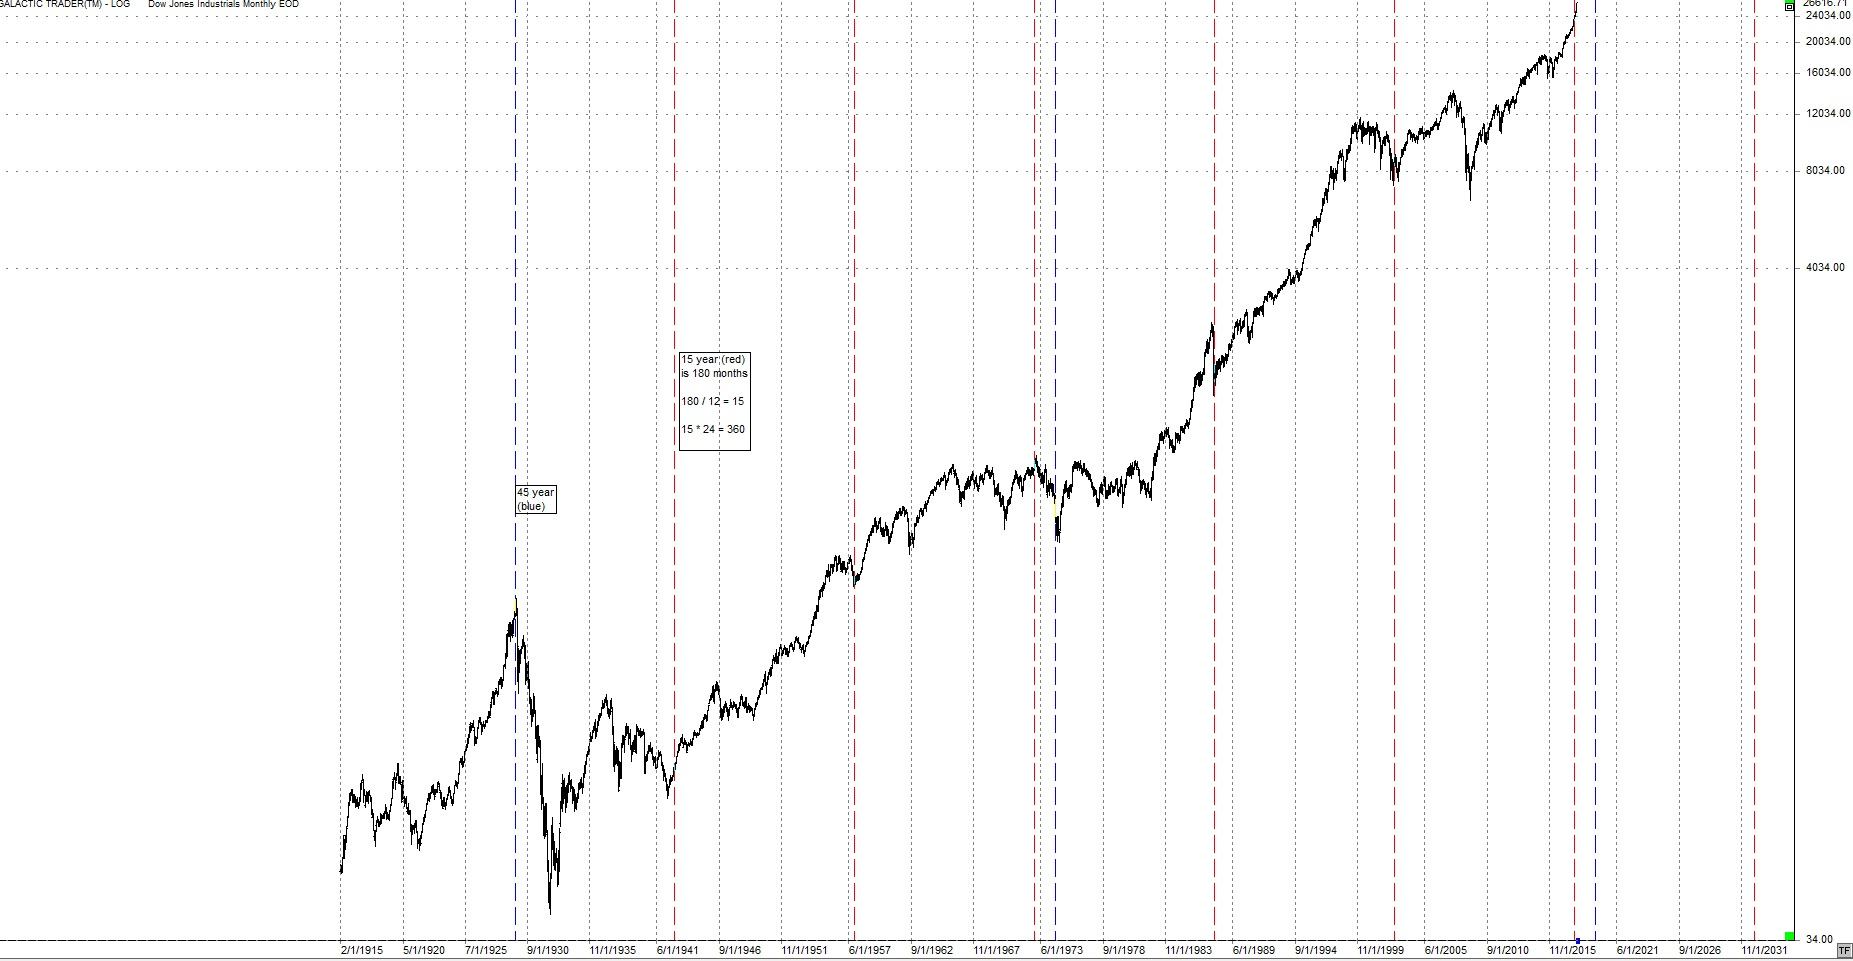
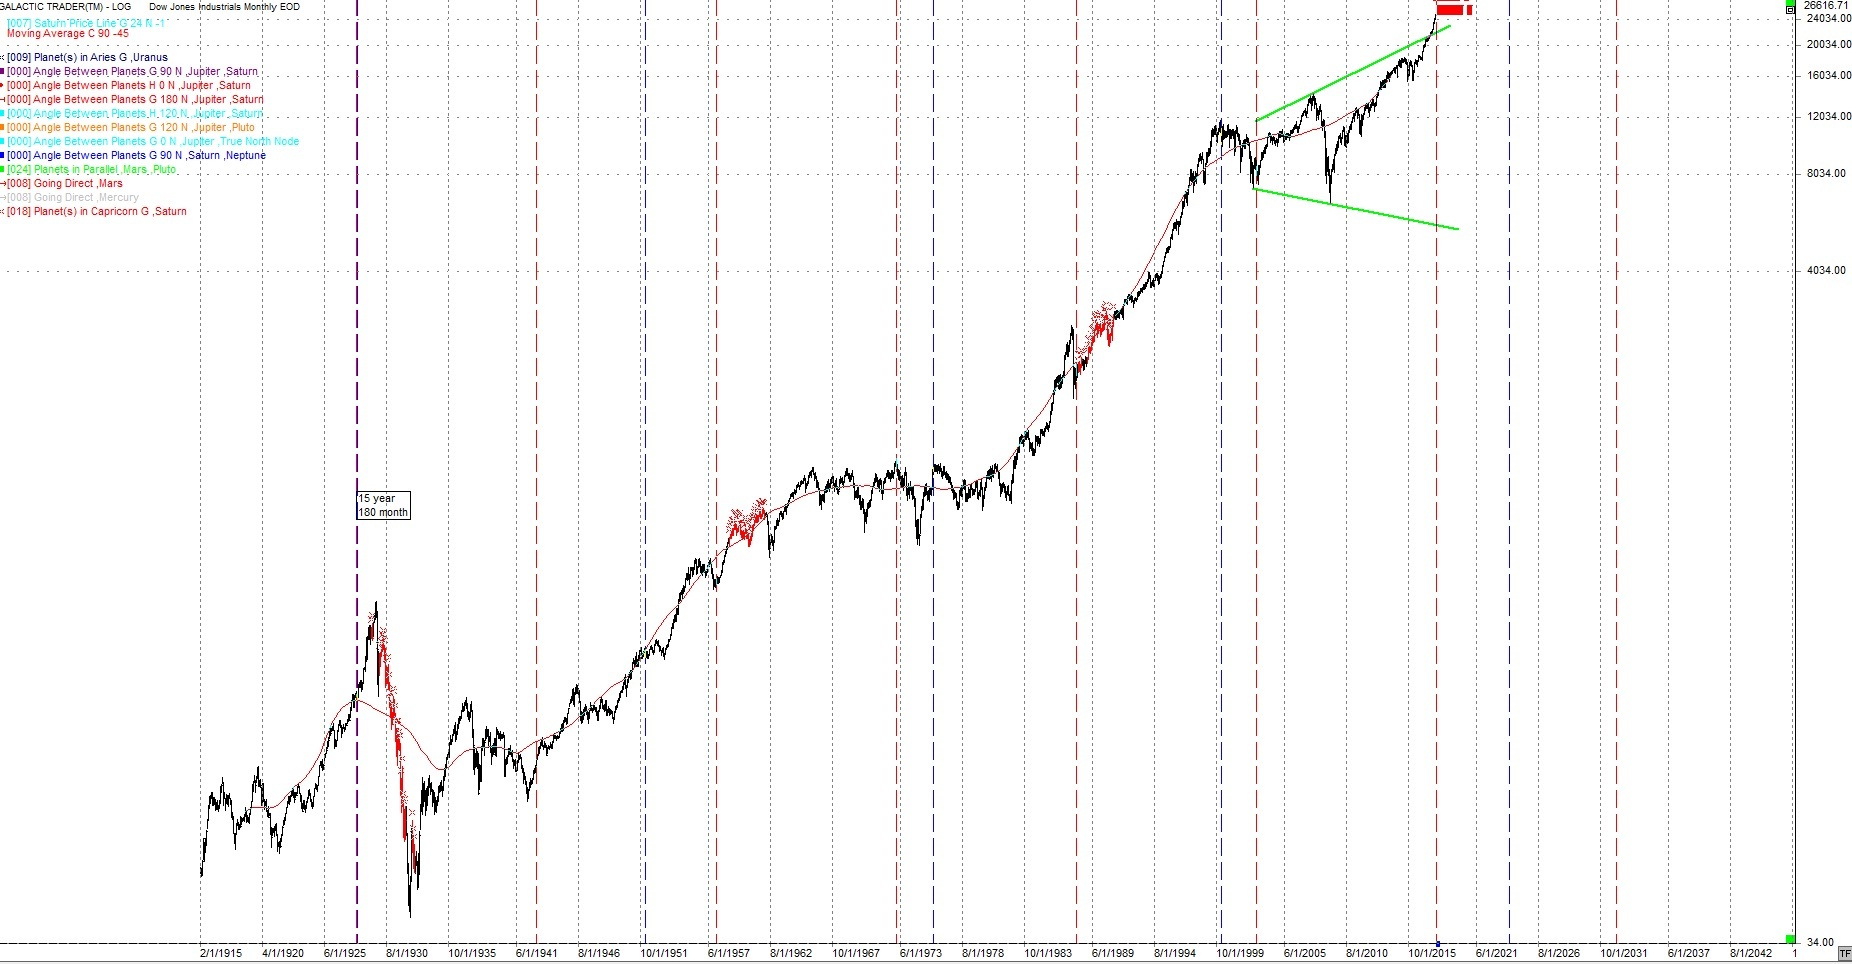
On a longer term basis the following monthly chart of the DJIA shows the 15 year cycle (red vertical lines) and the 45 year cycle (blue lines). The 15 year is due now, the 45 year due in Sept 2019. They need a broad orb of influence.
In May Uranus will enter Taurus. Look for financial or banking system problems or changes. Taurus will go retrograde and then move backward into Aries before Uranus enters Taurus for good. This may also be a problem in currencies.
Whether it is central bank money, corporate buy-backs or money from some other source we need to know the time periods where a correction is more probable. We look at Cycles and Astro events that have a history of being 65% - 72 % correct. We will continue with this approach.
We should stay aware the trends in the major US indices remain up and that is the way they should be played although the following cycles indicate a change in trend is coming.
Generally speaking the first couple of months of 2018 should be volatile. There are 2 Super Moons and 2 Eclipses.
Both eclipses are strong but the strongest should be the February 15 Solar Eclipse. This is almost opposite the August 21st eclipse last year. Both are in late Fixed signs. Remember all the violent weather we had after last years eclipse (Aug 21) and the continuing aggression. More on this as we get closer.
In addition, Feb 8 +- a few, has Pluto conjunct the heliocentric nodes of Pluto. This happens very slowly. It needs a broad range of dates. The last time Pluto was on the heliocentric nodes of Pluto was close to Feb 20, 1772.
The above combination, with Saturn, could be defining problems / restrictions for the general population, particularly the mature population and with the Sun could affect the President or other leaders. This combination could affect a number of years in the future as Saturn is in a sign for approx.. 2 ½ years. Other conditions this may highlight are State funerals, public sorrow and disappointment in general. State assets could be affected as well as industries connected to metals and mining.
The following monthly chart of the DJIA shows when Saturn has been in Capricorn (red x’s). Notice they have all had significant drops. This chart also has the 40 year cycle which will be coming due in 2018.
There could be some type of surprise coming in 2018 from the government or exposing something from the past. There could also be a major breakdown in world affairs or leaders.
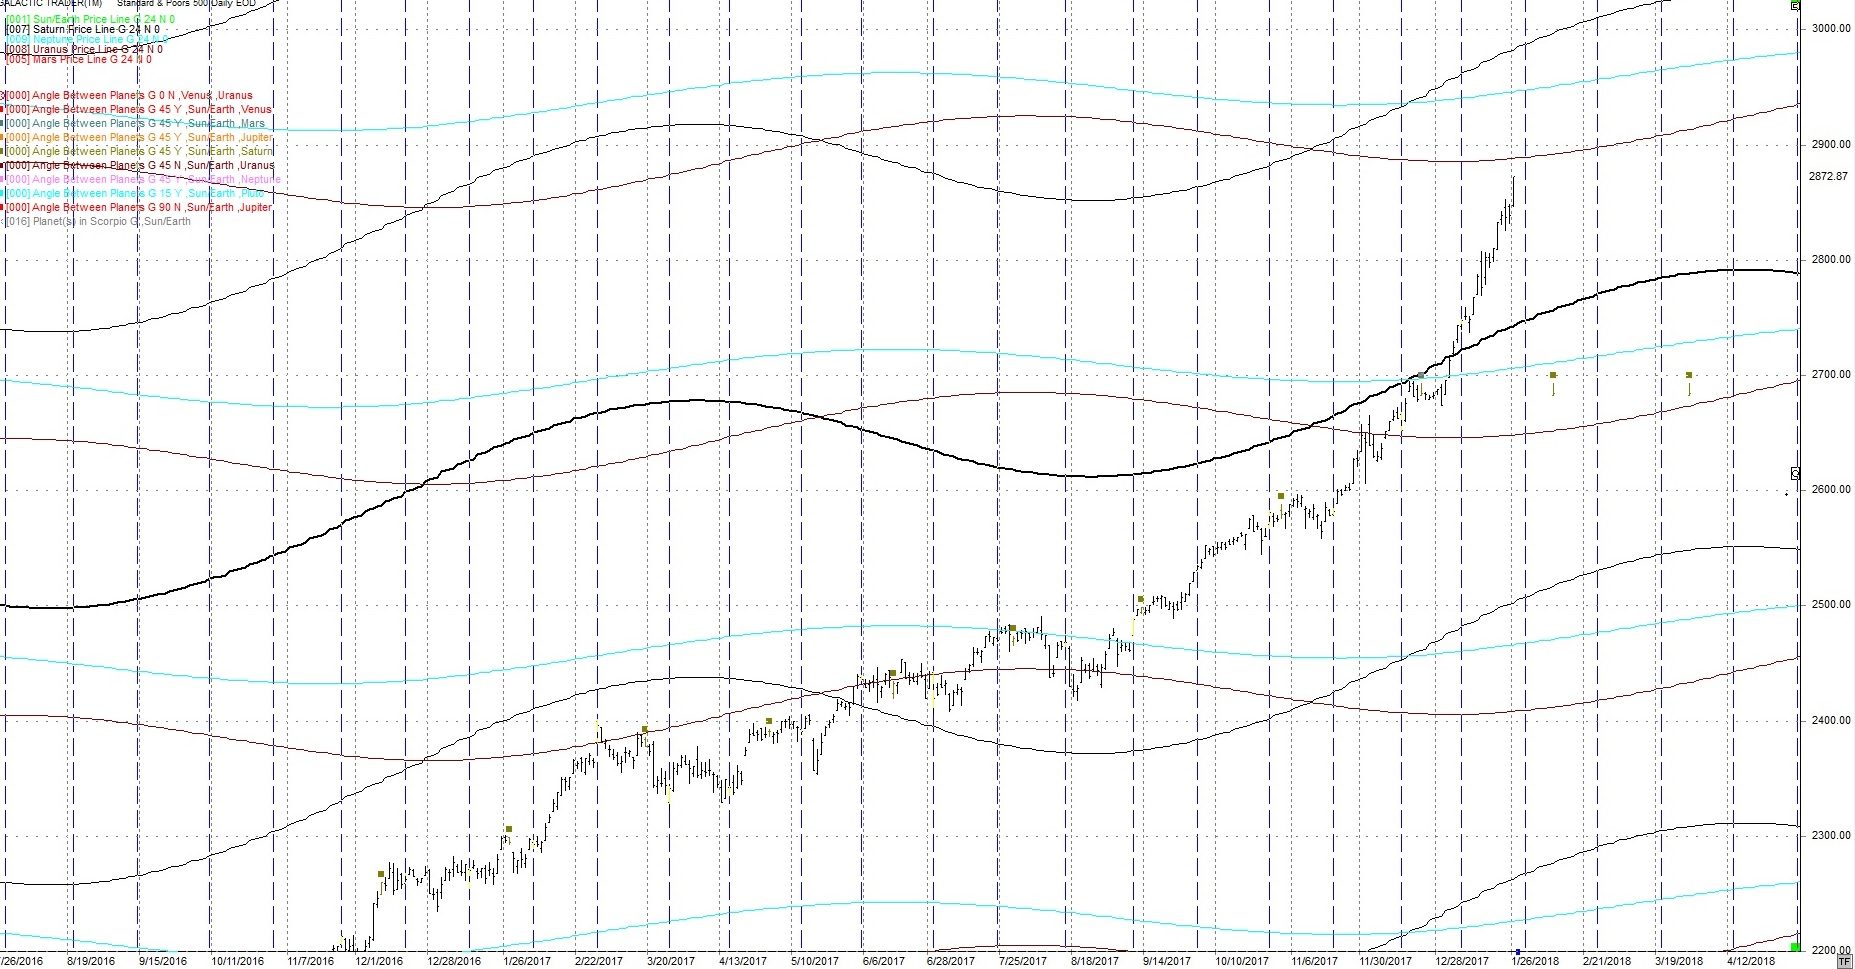
The following daily chart of the SP500 shows the Jupiter price line (blue) and the Sun/Earth price line (green). Both of these price lines have a history of providing support and resistance.
When the two lines cross we often see a big range day or reversal. Price is now approaching the next blue Jupiter price line near the top of the chart. Watch to see if this provides resistance. Jan 22 is the next date the Earth Price line crosses the Jupiter price line, Note the darker green line directly above price.
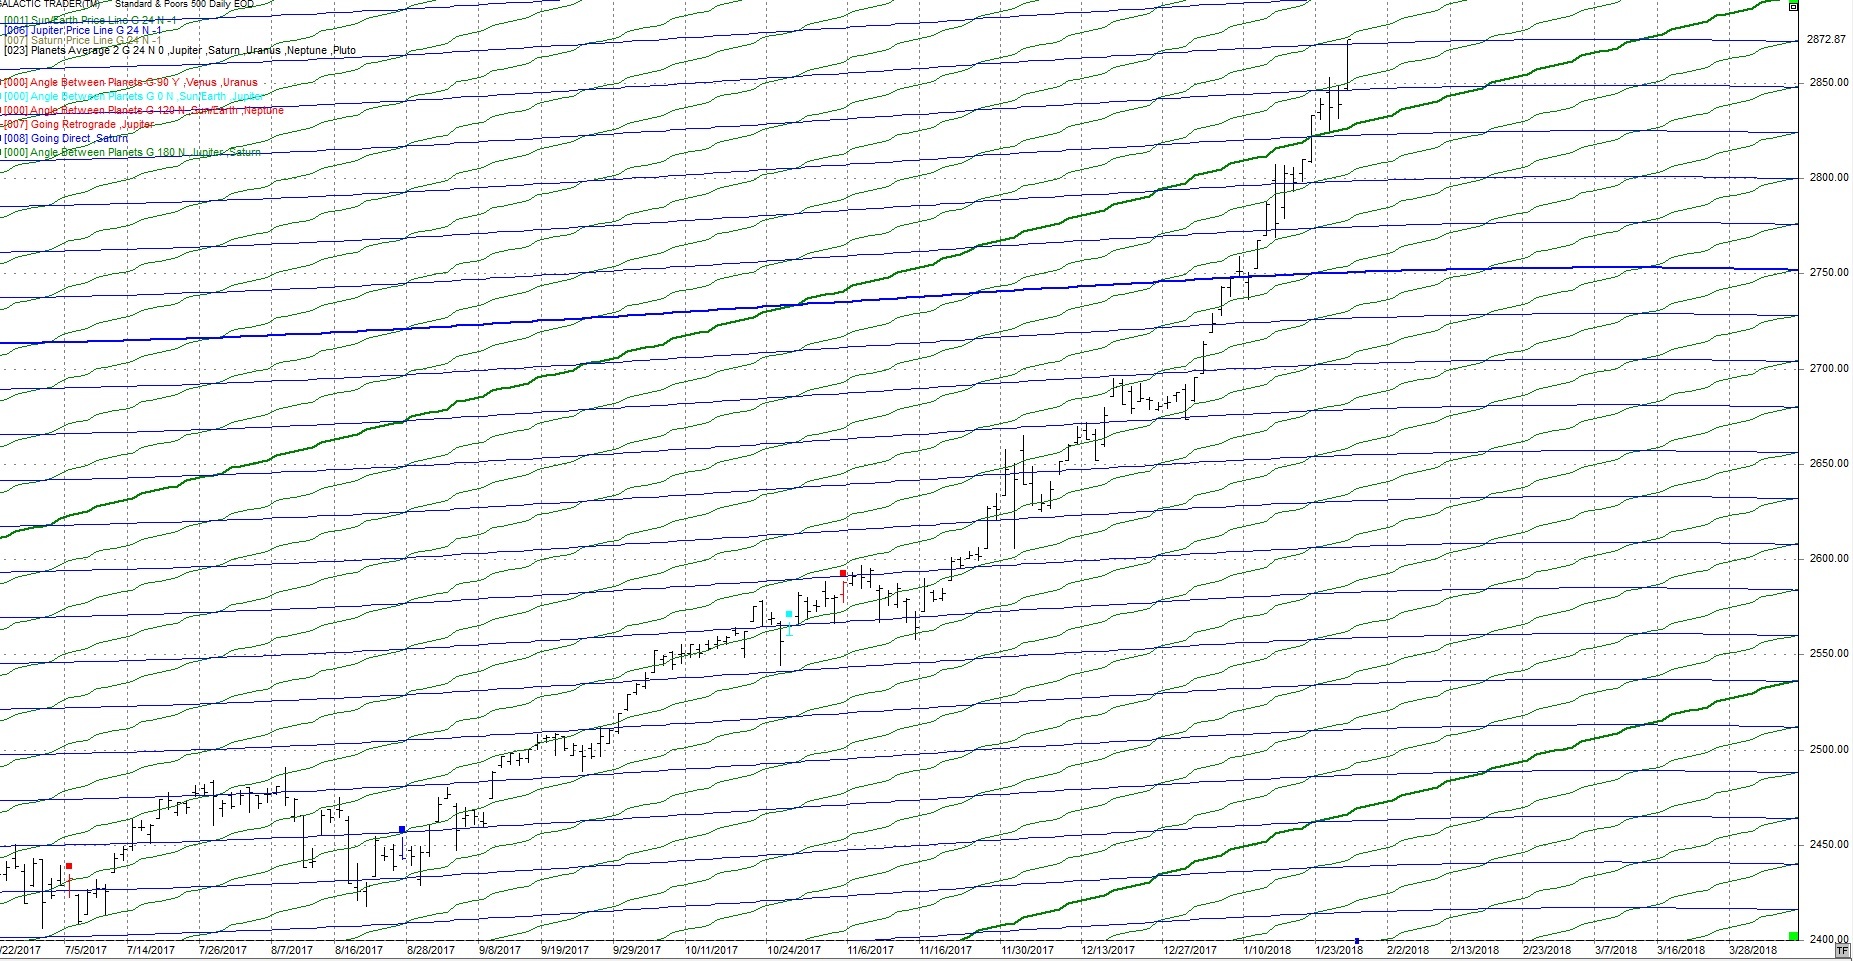
I continue to watch the 24th harmonic cycle (360 / 24) cycles for short term turns. The brown squares are Sun / Saturn 24 degrees on the following daily chart. The blue vertical lines are 24 cd’s (calendar days).
The next hit is Feb 9, 2018 and March 29, 2018. I have added 3 price lines to this chart.
- Saturn – black
- Uranus – purple
- Neptune - light blue
These price lines can act as support / resistance. It has been at highs and lows. Note also when they cross often gets a reaction in price on a short-term basis. Also note, near the top of the chart is a light blue line. This is the Neptune Price Line. Note how it has been strong resistance to price but has broken through. It should act as strong support when the market turns down.
Author

TradingDaze
Aisys Technologies Inc.
Gordon Lawson, aka TradingDaze, is a Canadian CPA, certified computer programmer and Astrologer. My traditional career spanned 25 years as a Financial Analyst at Suncor and Manager of Information Systems at BP Resources Canada. After this time Mr.


