WTI oil is currently trading at $63.00 - down 18 percent from the yearly high of $76.90 hit on Oct. 3.
The short-term charts are indicating that the sell-off has likely run out of steam. The long-term charts, however, are favoring a further slide to support of the trendline drawn from the February 2016 low and June 2017 low, currently at $59.00.
Monthly chart

Chart source: Netstation
As can be seen, WTI failed to beat the trendline from 2008 highs and ended up creating a bearish outside reversal last month. That candlestick pattern represents a bullish-to-bearish trend change.
What's more, the 5-month and 10-month SMAs have rolled over in favor of the bears and could produce a bearish crossover. Prices have also found acceptance under the 200-month SMA, having failed to clear the 100-month SMA twice in the last four months.
Weekly chart
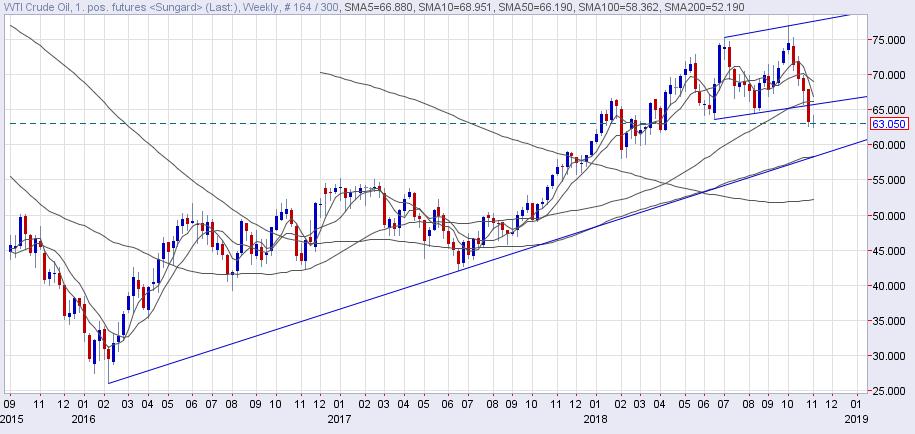
Chart source: Netstation
Over on the weekly chart, WTI closed below the channel support last week, opening the doors for a deeper loss.
The 5-, 10-week SMAs are trending south, having charted a bearish crossover in the previous weeks.
Looking at the monthly and weekly chart, it appears that the bears will likely have more say in determining the price of oil in the near future. As a result, a drop to the rising trendline (from Feb. 2016 low) could be in the offing before the end of the calendar year.
The drop to trendline support, however, is more likely to happen after a minor corrective rally.
Daily chart
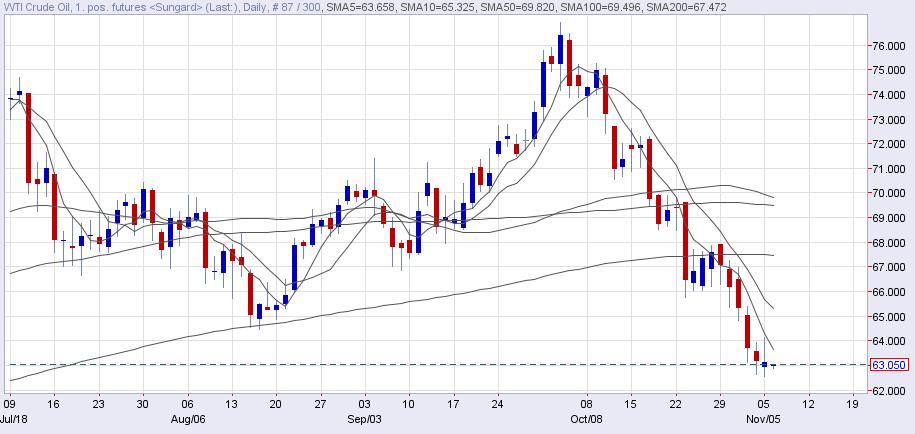
Chart source: Netstation
WTI created a spinning bottom candle yesterday, which is widely considered a sign of indecision. However, in WTI's case, it has appeared at the bottom of the recent slide, hence it could be considered a sign of bearish exhaustion. A short-term bullish reversal would be confirmed if today's candle closes above yesterday's high of $64.14.
Moreover, a bullish close is likely to happen as the RSI on the hourly and 4-hour chart has diverged in favor of the bulls.
To conclude, WTI could see a recovery rally to downward sloping 10-day SMA, currently at $65.32, before resuming the sell-off toward the support of the trendline rising from February 2016 lows.
Information on these pages contains forward-looking statements that involve risks and uncertainties. Markets and instruments profiled on this page are for informational purposes only and should not in any way come across as a recommendation to buy or sell in these assets. You should do your own thorough research before making any investment decisions. FXStreet does not in any way guarantee that this information is free from mistakes, errors, or material misstatements. It also does not guarantee that this information is of a timely nature. Investing in Open Markets involves a great deal of risk, including the loss of all or a portion of your investment, as well as emotional distress. All risks, losses and costs associated with investing, including total loss of principal, are your responsibility. The views and opinions expressed in this article are those of the authors and do not necessarily reflect the official policy or position of FXStreet nor its advertisers. The author will not be held responsible for information that is found at the end of links posted on this page.
If not otherwise explicitly mentioned in the body of the article, at the time of writing, the author has no position in any stock mentioned in this article and no business relationship with any company mentioned. The author has not received compensation for writing this article, other than from FXStreet.
FXStreet and the author do not provide personalized recommendations. The author makes no representations as to the accuracy, completeness, or suitability of this information. FXStreet and the author will not be liable for any errors, omissions or any losses, injuries or damages arising from this information and its display or use. Errors and omissions excepted.
The author and FXStreet are not registered investment advisors and nothing in this article is intended to be investment advice.
Recommended Content
Editors’ Picks
EUR/USD retreats below 1.0850 ahead of Fedspeak

EUR/USD stays under modest bearish pressure and trades in negative territory slightly below 1.0850 after closing modestly lower on Thursday. In the absence of macroeconomic data releases, investors will continue to pay close attention to comments from Federal Reserve officials.
GBP/USD stays under modest bearish pressure near 1.2650

GBP/USD edges lower toward 1.2650 after posting marginal losses on Thursday. The US Dollar holds its ground following the selloff seen after April inflation data and makes it difficult for the pair to gain traction. Fed policymakers are scheduled to speak later in the day.
Gold holds steady above $2,380, Fed speakers in focus

Gold trades with a positive bias on Friday and holds above $2,380. The benchmark 10-year US Treasury bond yield stays flat near 4.4% following Thursday's rebound, allowing XAU/USD to keep its footing ahead of speeches from Fed officials.
XRP steadies at $0.51 as Ripple plans to expand XRP Ledger, custody services in Africa

Ripple hovers close to $0.51 on Friday, above the psychologically important $0.50 level, as traders await the court ruling of the lawsuit against the US SEC and amid new commitments from the firm to expand its services in Africa.
Disputes and De-risking: US-China trade dispute changes trade flows

The bilateral trade dispute between the US and China is entering a new round and is leading to renewed discussions about the deglobalisation of global trade in goods.