There are certain prevailing characteristics that have existed at cyclical turning points in the market over history. These phenomena build over the course of the cycle and , to some extent, feed in to the cycle driving higher or lower.
One of these characteristics is screaming at the top of its lungs right now!
In this article I will show you:
- the one turning point indicator I believe we all should be paying attention to.
- indications of a generally over extended and over bullish market.
- and the most likely future outcome for the stock market given these conditions.
There is no methodology or indicator or theory or person that can predict the future direction of the market. At every moment in time the market is poised on a knife edge, eager to go one direction or another.
CAN I PREDICT THE FUTURE?
No!
But that never stopped me trying!
A hard learned lesson, is a valuable one!
The one insight we can take from the movements of the market over time is this,
The longer a market trends in a particular direction, the closer it gets to the inevitable turning point.
Irving Fisher stated on October 21 1929 that:
"Stock prices have reached what looks like a permanently high plateau."
He made this statement after 6 months of flat trading, the Dow Jones traded within a +/- 15 point range for that whole period. It is very easy to see how he came to this conclusion, however wrong it proved to be.
Three days later, on October 24 ("Black Thursday"), the market lost 11 percent of its value at the opening bell on very heavy trading. Irving made a simple rookie mistake when it comes to trading, and life in general.
He extrapolated the conditions of the past straight ahead into the future.
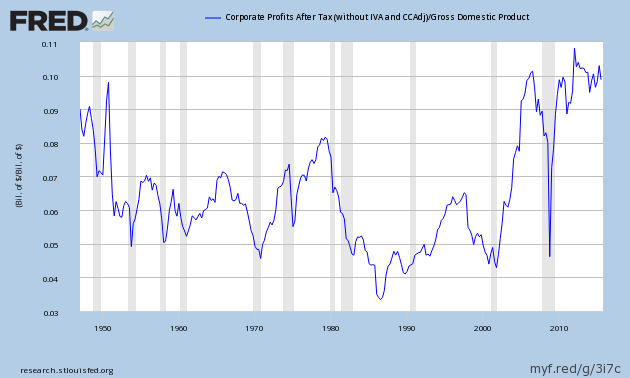
Now this brings me to the topic at hand, the St Louis FED publishes a simple series every quarter, it is the reported Corporate profits after tax of the listed corporations within the U.S. as a percentage of GDP.
The series can be found here https://research.stlouisfed.org/fred2/graph/?g=cSh
This graphic on its own is not particularly awe inspiring, but we can gleam some interesting points from it.
- It shows that over time, profits in the economy have fluctuated from the lows in the 1980's of about 3.5% to highs of about 10%.
- It shows us that the average in the series is around 6%.
- it shows us that profits tend to oscillate from lows to highs and back again.
- and it shows us that profits do not stay permanently high or low.
It also shows that right now we seem to be at a permanently high plateau, don't you think? I imagine Irving Fischer might have something to say about it.
Past performance is not an indication of future performance.
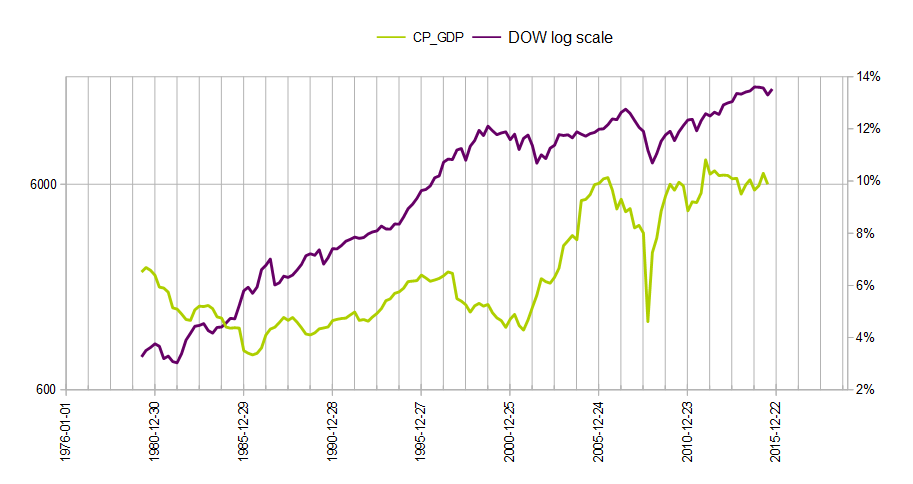
The corporate profit series gets very interesting when we overlay the DOW on top of the data. and here is what we get.
The new chart really does offer some insight into the position of the wider market as a whole and how far into its current cycle it is. A couple of points off hand.
- Corporate profits turned down in Q4 1997 the market turned down 2 years later in November 1999.
- Corporate profits turned up in Q4 2001, the market turned up 9 months later in Q3 2002.
- Corporate profits turned down in Q3 2006, the market turned down 1 year later in October 2007.
- Corporate profits turned up in Q4 2008, the market turned up 6 months later in Q2 2009.
- Corporate profits turned down in Q1 2012 and made a lower high in Q2 2015, the market has not given in, yet.
Are we to believe that ever higher prices for stocks are now the newnormal?
have we in-fact reached the fabled permanently high plateau?
I think history may be ready to teach us a lesson.
Conclusion.
Winston Churchill once said that the more of history you understand, the more of the future you will see.
If history is anything to go by, then the very least we can expect is for corporate profits as a percentage of GDP to swing back lower again, cross the 6% average , as is normal, and come down to touch the lower boundary which would be in the 3.5% area.
There is nothing out of the ordinary or crazy about this prediction. it is simple historical precedent.
This is where it gets interesting.
As can be seen above, a cyclical change in corporate profits is followed in short order by a cyclical change in the stock market. The previous two cycle highs in the stock market have resulted in 45% and 55%losses occurring by the time the cycle was over.
A similar result should not only be pondered, it should be anticipated and prepared for.
And again there is nothing out of the ordinary or crazy about this prediction. it is simple historical precedent.
Then again. Maybe things really are 'different this time'.
Trading in Forex Exchange Market is VERY SPECULATIVE AND HIGHLY RISKY and is not suitable for all members of the general public but only for those investors who: (a) understand and are willing to assume the economic, legal and other risks involved. (b) Taking into account their personal financial circumstances, financial resources, life style and obligations are financially able to assume the loss of their entire investment. (c) Have the knowledge to understand Forex Exchange Market and the underlying assets.
Recommended Content
Editors’ Picks
EUR/USD clings to gains above 1.0750 after US data

EUR/USD manages to hold in positive territory above 1.0750 despite retreating from the fresh multi-week high it set above 1.0800 earlier in the day. The US Dollar struggles to find demand following the weaker-than-expected NFP data.
GBP/USD declines below 1.2550 following NFP-inspired upsurge

GBP/USD struggles to preserve its bullish momentum and trades below 1.2550 in the American session. Earlier in the day, the disappointing April jobs report from the US triggered a USD selloff and allowed the pair to reach multi-week highs above 1.2600.
Gold struggles to hold above $2,300 despite falling US yields

Gold stays on the back foot below $2,300 in the American session on Friday. The benchmark 10-year US Treasury bond yield stays in negative territory below 4.6% after weak US data but the improving risk mood doesn't allow XAU/USD to gain traction.
Bitcoin Weekly Forecast: Should you buy BTC here? Premium

Bitcoin (BTC) price shows signs of a potential reversal but lacks confirmation, which has divided the investor community into two – those who are buying the dips and those who are expecting a further correction.
Week ahead – BoE and RBA decisions headline a calm week

Bank of England meets on Thursday, unlikely to signal rate cuts. Reserve Bank of Australia could maintain a higher-for-longer stance. Elsewhere, Bank of Japan releases summary of opinions.

