![]() Richard Perry
Richard Perry
Independent Analyst
Market Overview
With earnings season coming to an end there is not much to be bullish about right now. Market sentiment is fairly negative with geopolitical risk still elevated on the Korean peninsula, whilst the political risk of Trump’s presidency remains a driving factor. Donald Trump’s administration continues to unravel. On Friday, Steve Bannon, Trump’s chief policy strategist resigned whilst Carl Icahn, an advisor on regulation followed suit. Initially, Wall Street reacted positively to Bannon’s resignation, as it arguably improves the position of Gary Cohn, a more market friendly advisor. However the chaotic nature of the administration just reflects how difficult it will be for Trump to achieve anything and this is a big concern for markets. Wall Street is suddenly looking more corrective and although Jackson Hole could be supportive, we are unlikely to get too many clues on monetary policy. Treasury yields bounced in the wake of Bannon’s resignation but remain on a downward path and this bounce is likely to be short-lived. However, on forex markets there is a sense that there is a mixture of consolidation (euro and sterling) whilst the safe havens of the yen and gold are around key medium term levels. This is all leaving the Dollar Index somewhat mixed. The next few days until Jackson Hole have limited economic calendar data to change sentiment.

Wall Street closed off its lows on Friday but was still lower with the S&P 500 -0.2% at 2425, whilst Asian markets have been mixed today (Nikkei -0.4%) and European indices are following a similar path in early moves. In forex, there is a mixed and uncertain feel to trading, with the mildest of rebounds for the dollar, but the yen remains an outperformer suggesting a slight safe haven tilt. In commodities, gold is also slightly higher, whilst oil is yet to get going after Friday’s five rig decline in the Baker Hughes rig count induced a sharp rally.
It is a quiet day on the economic calendar with no major economic announcements due.
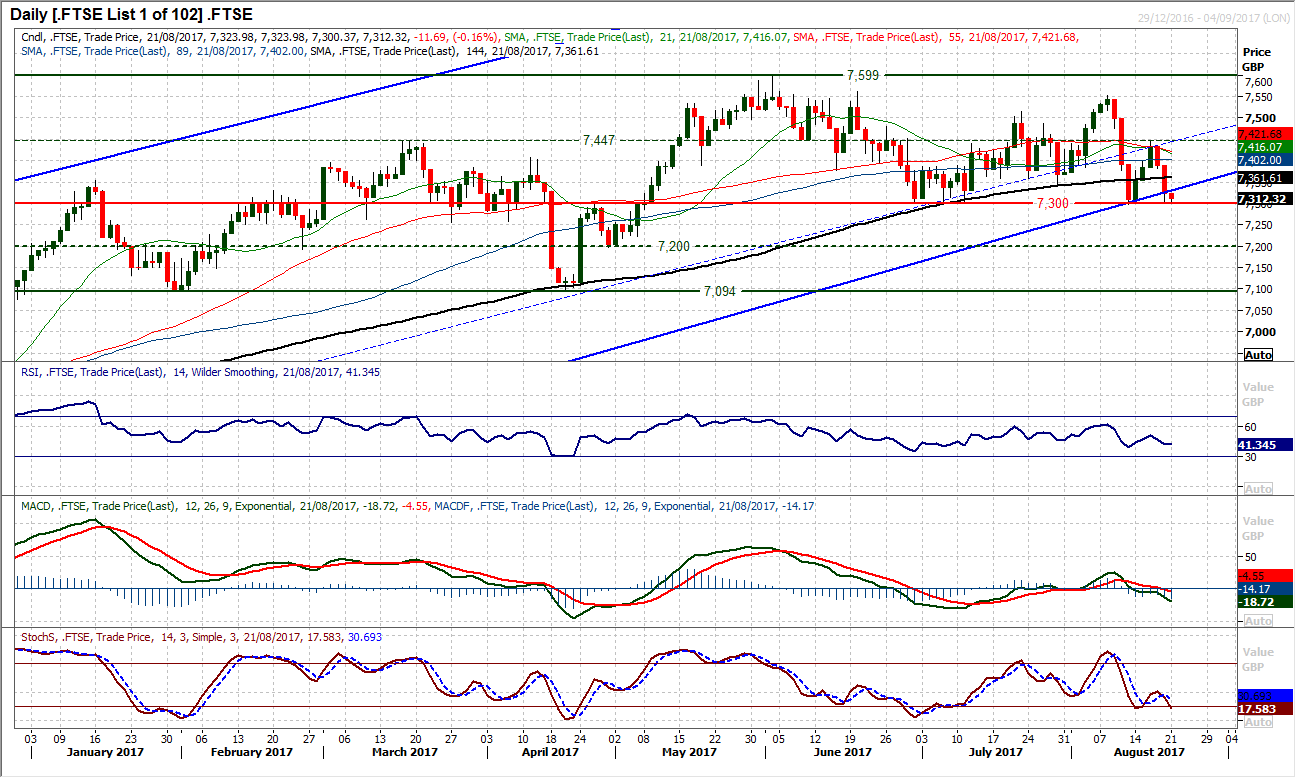
Chart of the Day – FTSE 100
The FTSE 100 has been consistently choppy in recent weeks and despite the fact that supposedly this is the quieter summer months, the average true range of around 65 ticks during August is the highest it has been for the whole of 2017. The market has been flying around but seemed to be still able to hold on to the longer term uptrend support last week. That was until Friday’s sharp bear candle not only breached the uptrend but also heaps pressure on the key support of the past couple of months at 7300. Despite a minor rebound into the close meaning that the market arguably hung on to the uptrend, today’s early move to the downside seems to be breaking the trend again. Furthermore, the key 7300 support is under threat too. On several occasions this support at 7300 has held the bears back, but this time, the momentum indicators are increasingly of concern, with the MACD lines falling below neutral and the Stochastics also crossing lower again. Part of this concern about the long term uptrend is that a support of a previous 8 month uptrend recently broken has also now become resistance in leaving last week’s high at 7445. The bears will be watching 7300 now with intent and a close below the support opening the key pivot at 7200 and the major April low at 7094. The hourly chart shows the wild ride of the past couple of weeks, with 7360/7400 now a basis of resistance and a lower high would increase the corrective pressure now.
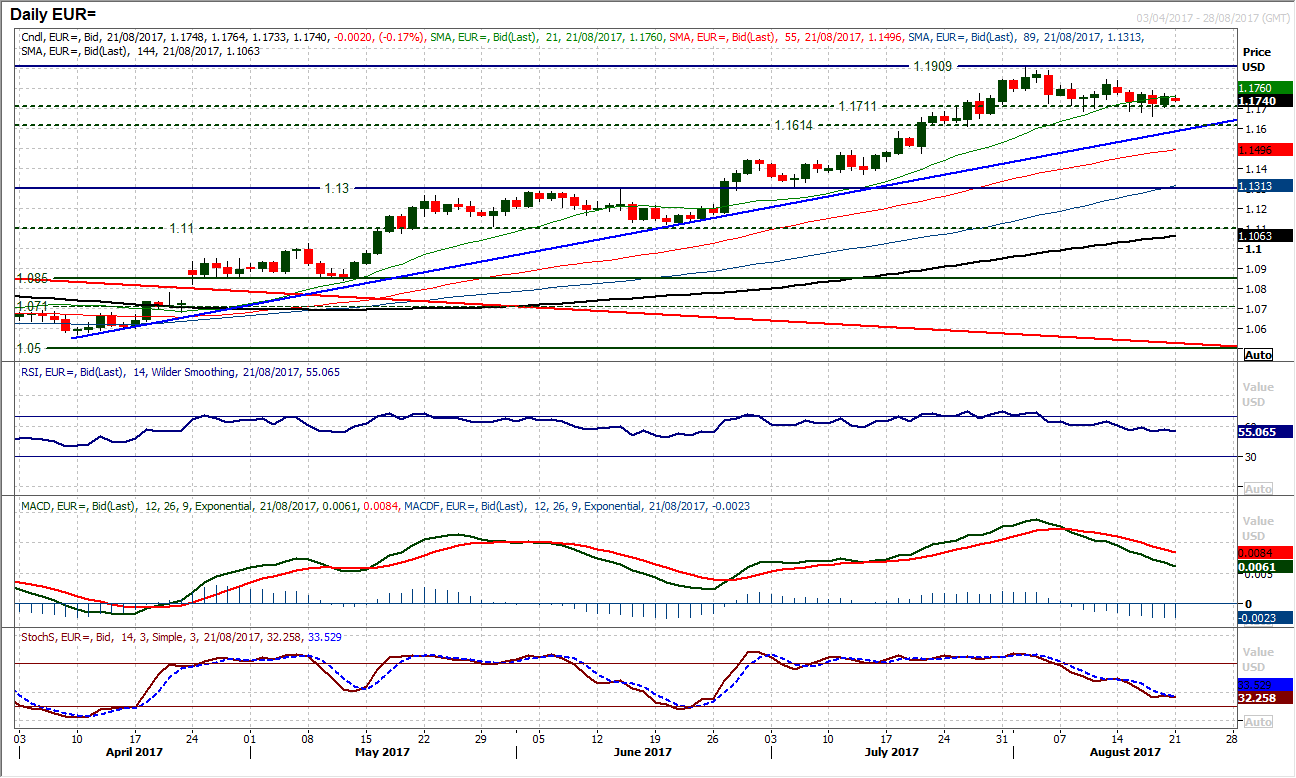
EUR/USD
The market remains subdued as traders begin to look ahead towards Jackson Hole. Friday’s mild positive candle does little to garner any real direction from a market that is now drifting with little conviction either way. There is still a feeling that the bulls are hanging on to the longer term breakout support of $1.1711 as the market as minor intraday breaches continue to be bought into, leaving support above $1.16660. The momentum indicators are unwinding back and there is still an expectation that this is part of a phase of the market looking to renew upside potential. This comes with the support of the four month uptrend which is today at $1.1585. The hourly chart reflects the recent consolidation with moving averages flat and momentum ranging. Initial support is $1.1705, with $1.1790 limiting the upside initially to protect the lower high at $1.1845.
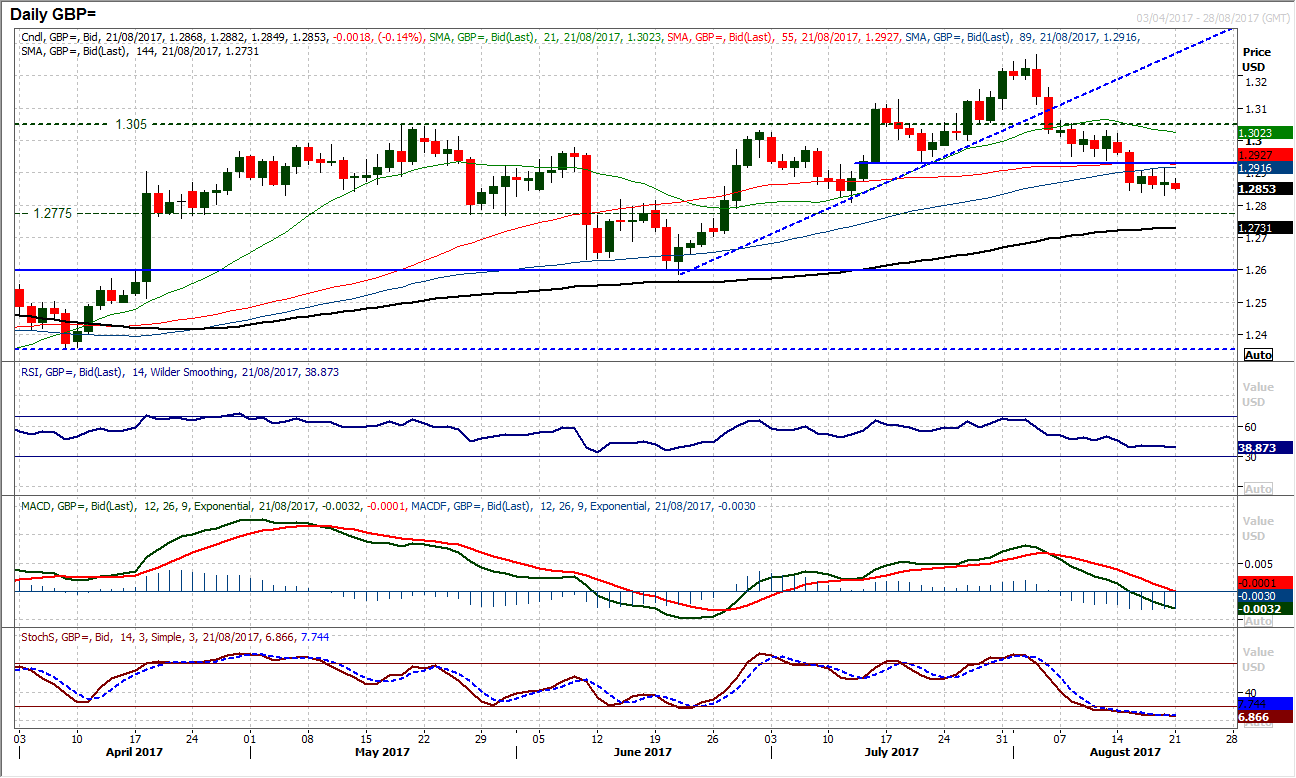
GBP/USD
As with the euro, there is a degree of consolidation on sterling against the dollar. The direction has been lost over the past few sessions and Friday’s candle does little to inspire direction for the new week. An 85 pip range with a near mid-point close and tiny candlestick body reflects an indecisive market, a move that has continued into the early trading today. Momentum indicators remain corrective and with the market continuing to trade under the breakdown of $1.2930 there remains an expectation that there is a sell into strength. Although momentum has settled in the past few sessions, the bulls have been unable to gain any real traction and the hourly RSI continuing to fail around 60 reflects the likelihood of continued correction. Support is with Friday’s low at $1.2830 but a retreat to the July low at $1.2808 is still likely, with the long term breakout support around $1.2775.
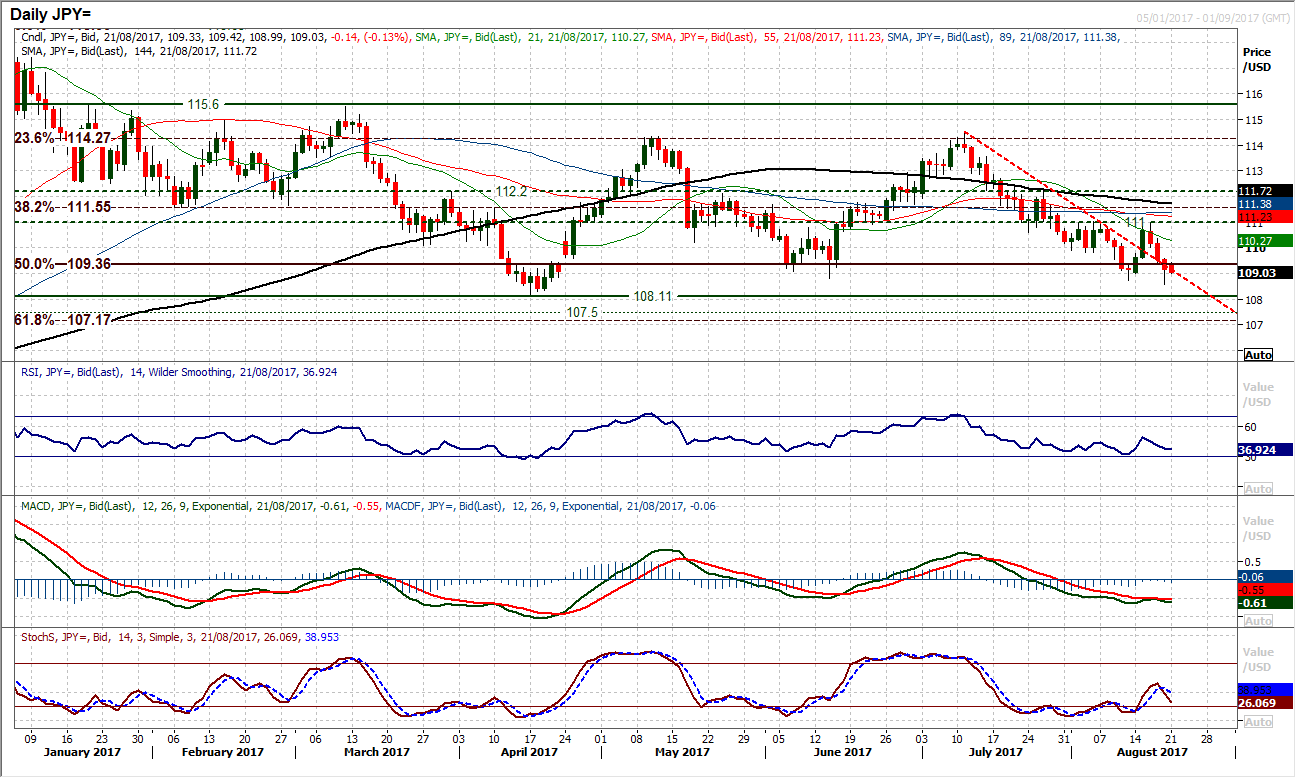
USD/JPY
The negative outlook remains intact amidst another bear close on Friday and the dollar remains under pressure. There is a slight caveat with the bounce off Friday’s low of 108.58, over 60 pips higher, however there is little to suggest that the bulls are in any position yet to mount a realistic recovery. The momentum indicators have turned lower again, with the RSI back under 40, Stochastics crossing lower and MACD lines looking ready to “bear kiss”. However, the hourly chart shows a pivot forming around 109.60, whilst hourly momentum implies this rebound is just helping to renew downside momentum once more. There is a chance that the bulls may be preparing for a basing process, with this trading phase coming around the key April (108.11) and June (108.81) lows, but for now the bears remain in control and a retest of the key supports is preferred. Above 111.00 is needed to change the outlook sustainably.
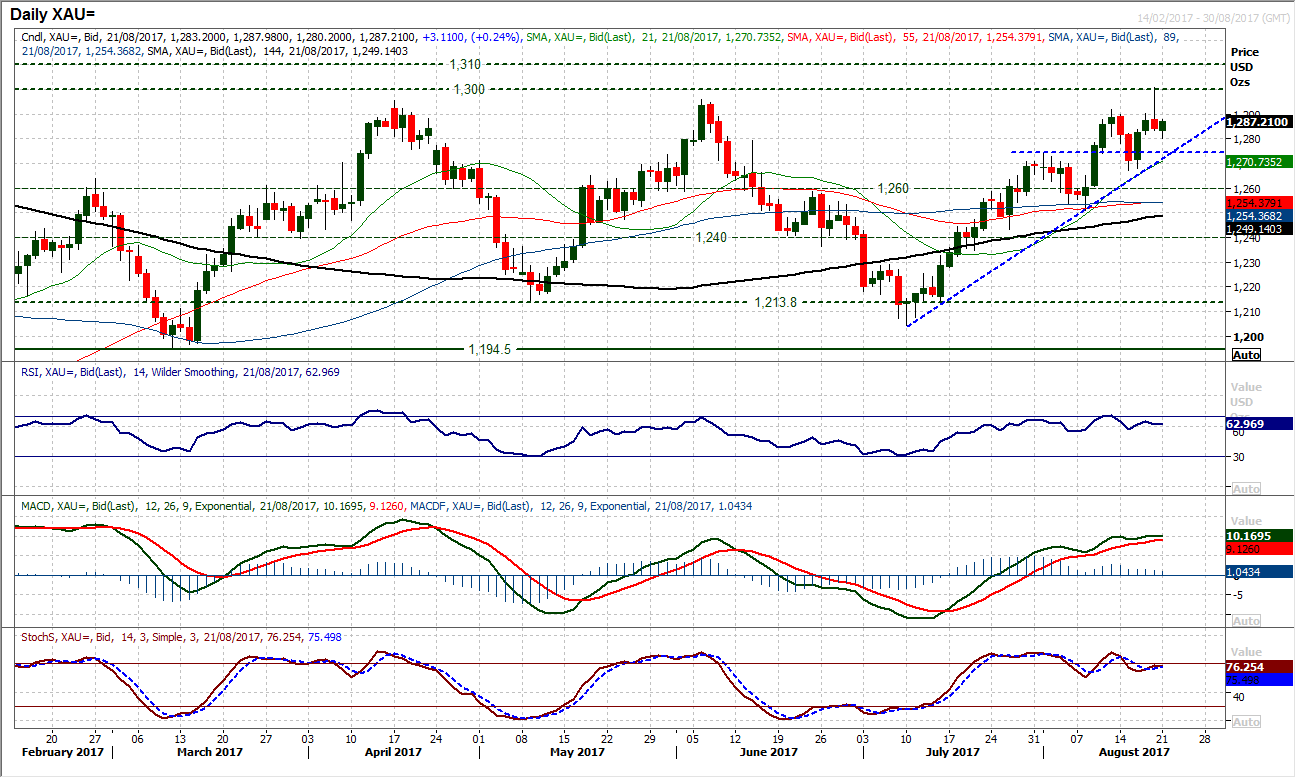
Gold
The one main factor that niggles with doubt over the continued weakness on Dollar/Yen is not actually on the Dollar/Yen chart at all. The big shooting star candlestick on gold is a one day sell signal and suggests that perhaps the dollar could be preparing a near term recovery. This shooting star on gold has come almost bang on the high of $1300, whilst there is a significant long term pivot band of resistance $1300/$1310 which has been a ceiling throughout 2017. Could the market now begin to retreat to test the support of the five week uptrend which comes in at $1272 today? Watch for the momentum indicators which are beginning to roll over. The MACD lines are flattening, whilst the RSI is looking now that it is struggling to get back towards 70 and the Stochastics are also looking a touch nervous. There is a band of support $1267/$1274 which will be seen as key on gold near term. For now, the hourly chart looks to be indecisive, with moving averages and momentum indicators fairly neutrally configured.
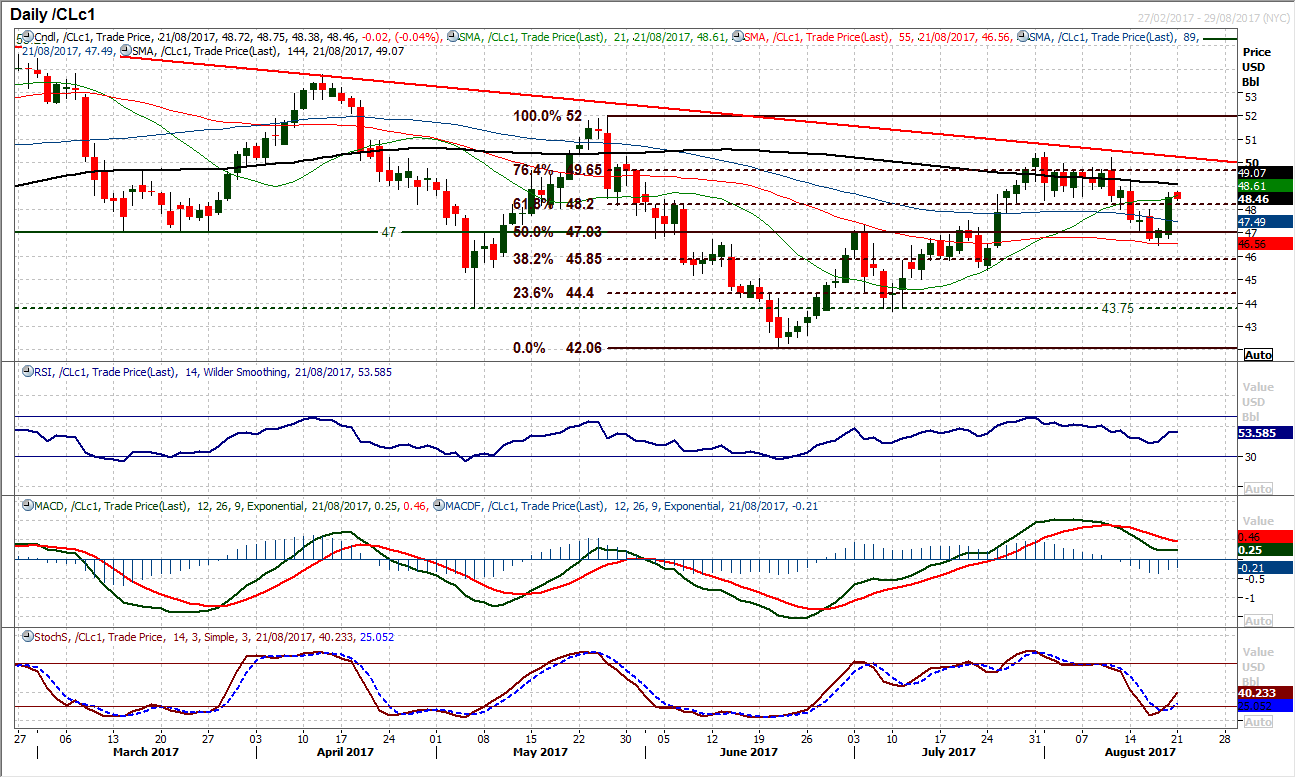
WTI Oil
A sharp bull candle posted on Friday as completely changed the outlook for WTI. A second successive week of reduction in the Baker Hughes rig count has been a key factor in driving the recovery and the bears have seemingly lost control again. This has left support now in place at $46.45, whilst the recovery has also quickly taken out a series of resistance levels left during a recent corrective phase. Holding on to the move back above $48.37 which could not have been considered to be overhead supply will now be the key factor in today’s session. The resistance at $49.15 will also be watched as a move back above would be another barrier broken for the bull recovery and would open $50.22. Momentum indicators are reacting to the upside, with the Stochastics crossing back higher and interestingly the RSI back above 50. The hourly chart shows a pivot at $48.00 which is supportive for the recovery now.
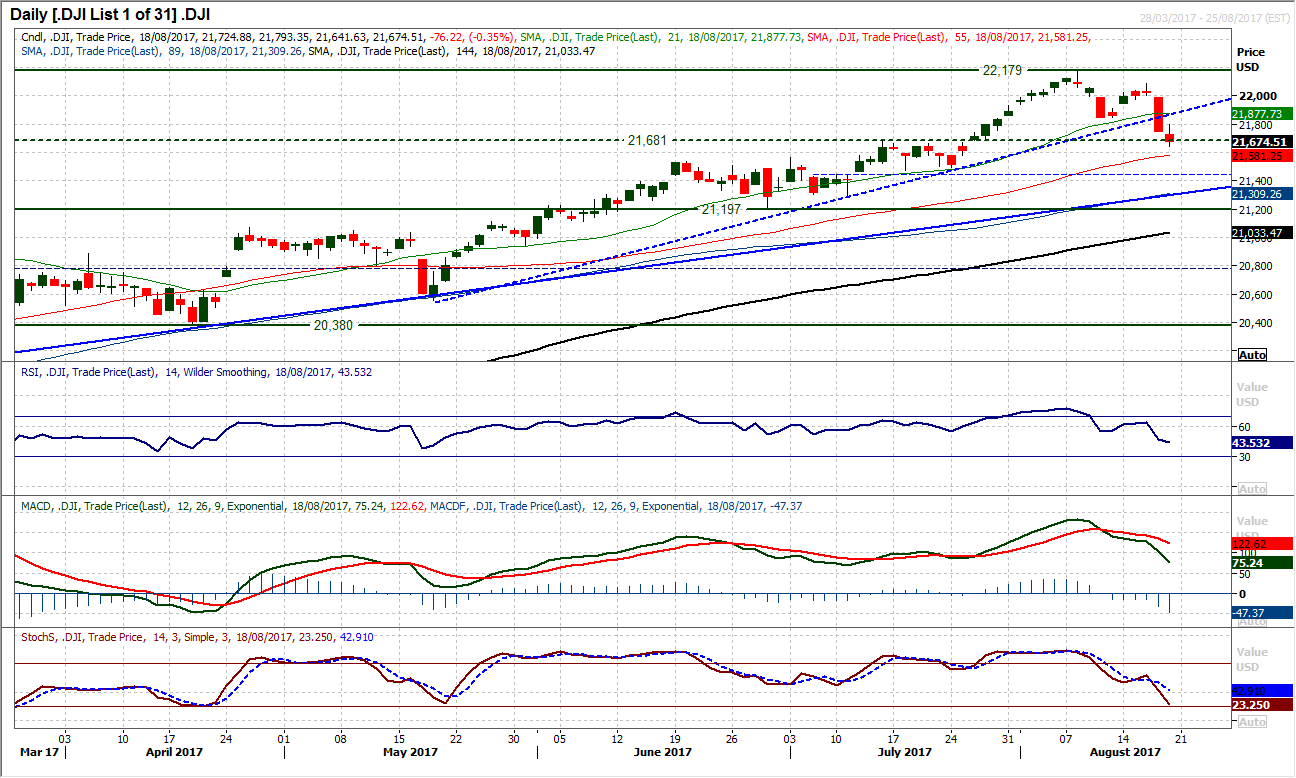
Dow Jones Industrial Average
The Dow is turning increasingly corrective. The decline of the past few sessions has seen the market close below the breakout support at 21,681. A two day close below the three month downtrend confirms the breakdown, whilst the market beginning to post lower highs and lower lows in conjunction with these breakdowns has the market in corrective mode. This is also reflected in the momentum indicators which are accelerating lower on the Stochastics and MACD lines, but with the RSI also at 3 month lows. This all suggests that rallies are now being sold into. The hourly chart shows resistance at 21,793/21,844. Initial support at 21,641 with a breach opening the 21,471 low.
Note: All information on this page is subject to change. The use of this website constitutes acceptance of our user agreement. Please read our privacy policy and legal disclaimer. Opinions expressed at FXstreet.com are those of the individual authors and do not necessarily represent the opinion of FXstreet.com or its management. Risk Disclosure: Trading foreign exchange on margin carries a high level of risk, and may not be suitable for all investors. The high degree of leverage can work against you as well as for you. Before deciding to invest in foreign exchange you should carefully consider your investment objectives, level of experience, and risk appetite. The possibility exists that you could sustain a loss of some or all of your initial investment and therefore you should not invest money that you cannot afford to lose. You should be aware of all the risks associated with foreign exchange trading, and seek advice from an independent financial advisor if you have any doubts.
Recommended Content
Editors’ Picks
EUR/USD holds above 1.0700 ahead of key US data

EUR/USD trades in a tight range above 1.0700 in the early European session on Friday. The US Dollar struggles to gather strength ahead of key PCE Price Index data, the Fed's preferred gauge of inflation, and helps the pair hold its ground.
USD/JPY stays above 156.00 after BoJ Governor Ueda's comments

USD/JPY holds above 156.00 after surging above this level with the initial reaction to the Bank of Japan's decision to leave the policy settings unchanged. BoJ Governor said weak Yen was not impacting prices but added that they will watch FX developments closely.
Gold price oscillates in a range as the focus remains glued to the US PCE Price Index

Gold price struggles to attract any meaningful buyers amid the emergence of fresh USD buying. Bets that the Fed will keep rates higher for longer amid sticky inflation help revive the USD demand.
Sei Price Prediction: SEI is in the zone of interest after a 10% leap

Sei price has been in recovery mode for almost ten days now, following a fall of almost 65% beginning in mid-March. While the SEI bulls continue to show strength, the uptrend could prove premature as massive bearish sentiment hovers above the altcoin’s price.
US core PCE inflation set to signal firm price pressures as markets delay Federal Reserve rate cut bets

The core PCE Price Index, which excludes volatile food and energy prices, is seen as the more influential measure of inflation in terms of Fed positioning. The index is forecast to rise 0.3% on a monthly basis in March, matching February’s increase.