After posting continuous losses over the past few of months, the Looney may finally have some upside potential. While I don’t think anyone expects the pair to erase the epic plunge which started in January, a bearish rectangle may see the USD claim back some ground in the short term. Looking at the technicals reveals a number of compelling reasons to expect a decent rally for the pair, in spite of the spate of recent US economic indicator disappointments.
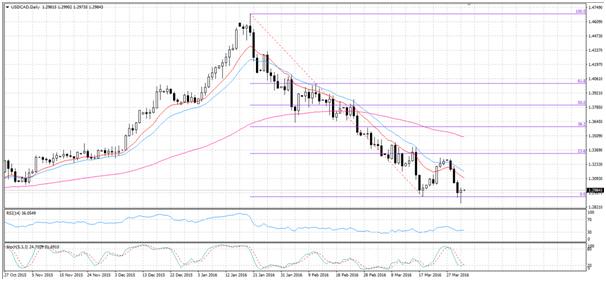
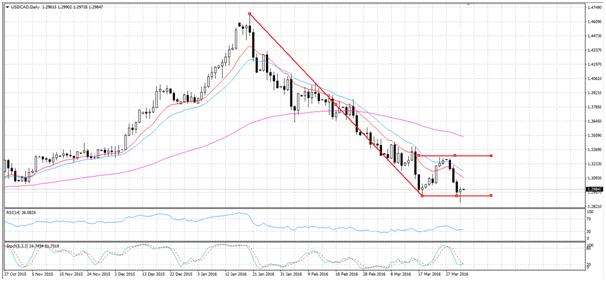
A cursory glance at the daily chart may at first appear to show the recent trend continuing within a bearish channel. Whilst there is definitely a high probability for a continuation pattern, the evidence points to wide a bearish rectangle and not a simple channel. The Fibonacci retracement demonstrates that the Looney currently ranges within two retracements levels. Specifically, the pair ranges between the 23.6% resistance and 0.0% support zones at 1.3338, and 1.2921, respectively.
Subsequently, the Looney should be moving towards the 23.6% retracement level at least once more in order to complete the rectangular pattern. The latest chart data appears to support this movement for the pair as the last two daily candles are already beginning to climb higher. Furthermore, both Stochastic and RSI oscillators are signalling the pair is oversold or close to it. Subsequently, becoming oversold generates additional buying pressure to buoy the Looney and test the 1.3338 zone of resistance once again.
In addition to the technicals, the fundamentals will assist in bringing the rectangle pattern to completion. With an expected non-farm payrolls result of 205K and a positive change to the Michigan consumer sentiment index up to 90.5, the USD should claw back some of the recent losses. On the back of the decent ADP non-farm payrolls result of 200K, it’s reasonable to expect the Bureau of Labour Statistics figures to also come in relatively favourably. Posting another solid result will go a long way in generating the requisite momentum to test the 23.6% zone of resistance. However, it is important to be aware of the divergence that occasionally occurs between the ADP and Bureau of Labour Statistics non-farm payroll results.
As a bearish rectangle is usually indicative of an eventual downside breakout, the pair cannot stay at or above the 1.3338 resistance for an extended period of time.With this chart pattern, a subsequent fall back to support is highly likely after testing resistance. As a result, keep a close eye on the pair as it draws closer to the zone of resistance to avoid being caught off guard by a reversal.
Ultimately, the Looney is likely to continue its downward slide until such a time that the US can show some real economic improvement. However, the short term may provide some respectable upside movement as the pair tests the rectangle it now finds itself in.
Forex and CFDs are leveraged financial instruments. Trading on such leveraged products carries a high level of risk and may not be suitable for all investors. Please ensure that you read and fully understand the Risk Disclosure Policy before entering any transaction with Blackwell Global Investments Limited.
Recommended Content
Editors’ Picks
EUR/USD clings to gains above 1.0750 after US data

EUR/USD manages to hold in positive territory above 1.0750 despite retreating from the fresh multi-week high it set above 1.0800 earlier in the day. The US Dollar struggles to find demand following the weaker-than-expected NFP data.
GBP/USD declines below 1.2550 following NFP-inspired upsurge

GBP/USD struggles to preserve its bullish momentum and trades below 1.2550 in the American session. Earlier in the day, the disappointing April jobs report from the US triggered a USD selloff and allowed the pair to reach multi-week highs above 1.2600.
Gold struggles to hold above $2,300 despite falling US yields

Gold stays on the back foot below $2,300 in the American session on Friday. The benchmark 10-year US Treasury bond yield stays in negative territory below 4.6% after weak US data but the improving risk mood doesn't allow XAU/USD to gain traction.
Bitcoin Weekly Forecast: Should you buy BTC here? Premium

Bitcoin (BTC) price shows signs of a potential reversal but lacks confirmation, which has divided the investor community into two – those who are buying the dips and those who are expecting a further correction.
Week ahead – BoE and RBA decisions headline a calm week

Bank of England meets on Thursday, unlikely to signal rate cuts. Reserve Bank of Australia could maintain a higher-for-longer stance. Elsewhere, Bank of Japan releases summary of opinions.

