Is the bond market signaling a market bottom?
-
The 10-year U.S. treasury bond yield tends to move inversely with the S&P 500.
-
The negative correlation started in 2022 and has accelerated as the S&P 500 hit new lows after the 10-year peaked earlier.
-
A reversal signal candle on the 10-year yield may signal a bottom in the S&P 500 with a one to two week heads up.

It’s conventional knowledge that stocks and bonds tend to move inversely or have a negative correlation most of the time. When interest rates rise, stocks fall, bond yields rise, and bond prices fall. Interest rates haven’t been much of a factor for over a decade until inflation reared its ugly head at warp speed in the last year.
The consumer price index (CPI) is considered the inflation gage and it skyrocketed from mere a 1.4% in January 2021 to a high of 9.1% in June of 2022. The U.S. Federal Reserve Open Market Committee (FOMC) led by Chairman Jerome Powell insisted that the rising inflation was simply a transitory, meaning temporary, by-product of the COVID pandemic.
The lockdowns trigger demand shock
As businesses were temporarily forced to shut down by government mandates, they took production offline to save costs. Factories, facilities, and manufacturing plants were taken offline, and workers were furloughed or released as whole economies were halted and shutdown.
The global supply chain capacity was severely thinned out as businesses’ slashed their inventories to contain expenses and hold onto precious capital as revenue streams dried up.
This caused demand shock for most businesses that were not deemed “essential” like grocery stores like Kroger (NYSE:KR) and large retailers like Costco (NASDAQ: COST), Walmart (NYSE: WMT) and Target (NYSE:TGT).
While many businesses like restaurants and retailer apparel makers migrated to or beefed up e-commerce channels, the closure of brick-and-mortar stores inevitably caused revenues and stock prices to collapse.
The reopening triggers supply shock
With the spread of COVID vaccinations and the re-opening of businesses, economies went into supply shock from the shortage of products. The combination of pent-up demand and stimulus checks overwhelmed businesses that were taken offline.
Companies that downsized were left with the dilemma of rehiring workers often at a higher wage. Factories and plants taken offline needed time to get back online and resume production as evidenced by the supply chain disruption.
Commodities like semiconductors were in short supply leading to supply constraints of automobiles and the like. The rush of demand strained supply chains and already depleted inventories. Bringing them back online so quickly caused numerous bottlenecks with the shortage of shipping containers and cargo ships being stalled outside of ports for days to weeks at a time.
When large demand is met with small supply, prices tend to jump, and inflation is spawned. Because the pandemic was transitory, the FOMC believed that rising inflation would also be transitory as they maintained a 2% inflation target.
Unfortunately, they didn’t anticipate that supply chains would remain constrained for so long as commodity, fuel and food prices soared. A tight labor market triggered wage inflation further accelerated by the great resignation as workers opt to stay at home and collect stimulus payments. It’s worth noting that wage inflation is usually irreversible even when other forms of inflation start to fall.
The Fed’s severe about face
For over a year the Fed tried to pacify markets assuring that inflation was transitory while maintaining a dovish stance with kid gloves expecting a “soft landing”. As inflation accelerated, they stopped using the term transitory in 2022 as the prospects for a hard landing materialized.
The pendulum completely swung the other way as Chairman Powell turned hawkish perhaps realizing the complacency they injected into the markets.
They instituted aggressive monetary tightening with steady rate hikes that became more aggressive as they accelerated to 75 basis points per FOMC meeting with prospects for rate cuts pushed back to 2024. This simultaneously spiked bond yields and cratered the stock market.
Bonds versus stocks
Treasury bonds are considered risk-free and a risk-off asset. Stocks on the other hand have the risk of losing value and considered a risk-on asset. You’ll often hear the market being described as a “risk-on” day when its rising and a risk-off day when it’s falling.
This is a consideration that if stock markets get too volatile, then investors transfer their money from risk-on assets to safer risk-off assets like government bonds.
Negative correlation
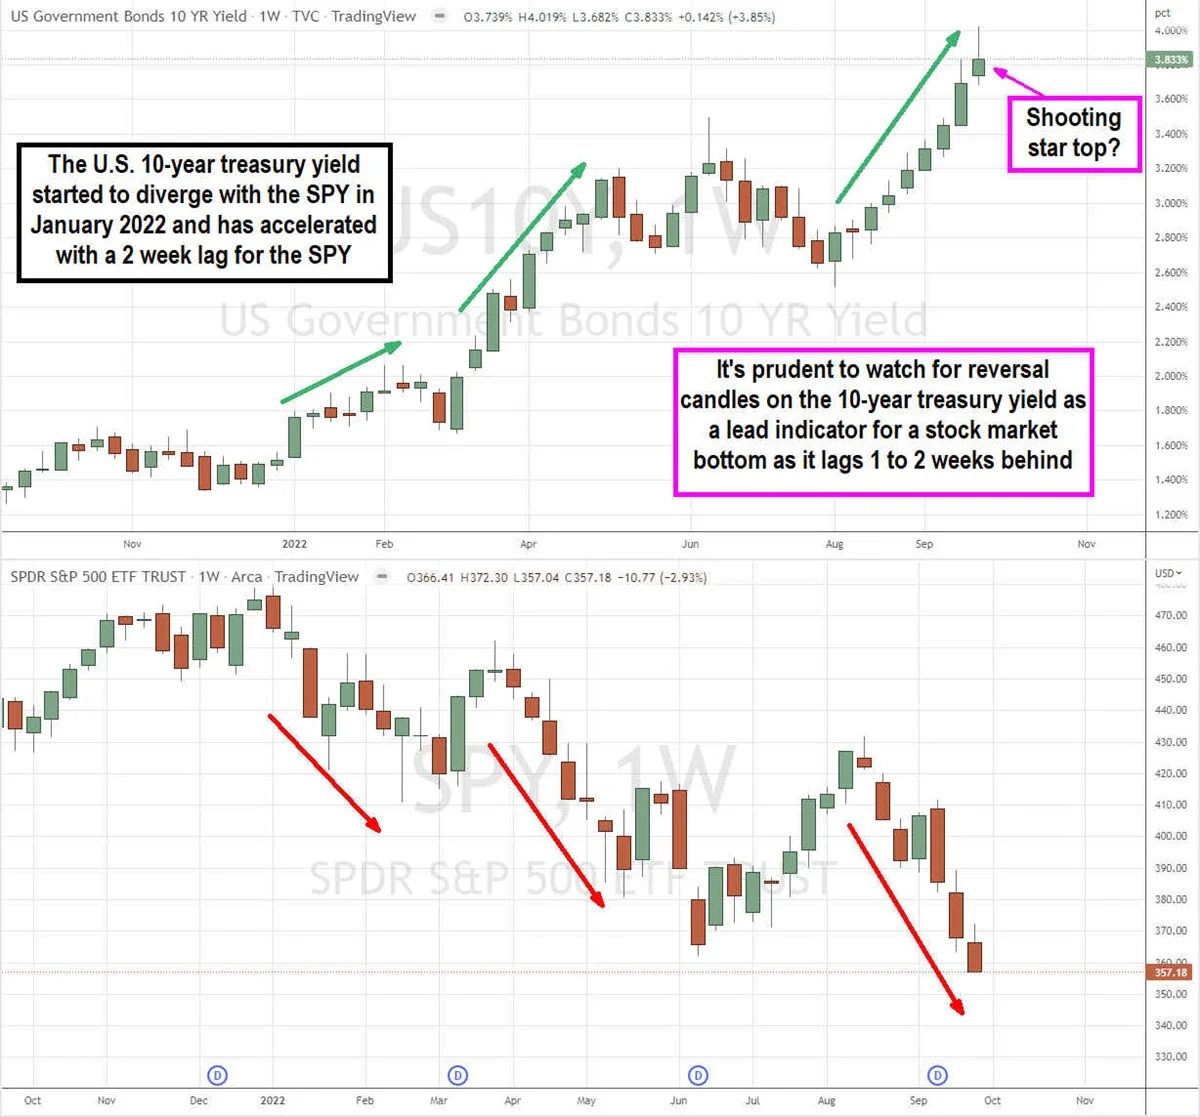
Visually comparing the 10-year T-bond yield to the S&P 500 (NYSEARCA: SPY), it becomes apparent that when bond yields rise, stock markets tend to fall. Based on the weekly charts, bond yields and the S&P 500 shared positive correlation up until the start of 2022.
From January 2022 forward, the negative correlation increased as equity markets started to fall while bond yields started to ascend. From the start of 2022, 10-year treasury yields rose from 1.52% to a high of 4.019% in the last week of September.
Meanwhile, the SPY fell from a high of $479.98 to new lows of $357.04 at the end of September plunging back into bear market territory down (-25%) on the year. Based on this accelerated negative correlation, one can assume the stock market “bottom” likely triggers at the “top” for 10-year treasury yields.
The 10-year has risen higher for nine consecutive weeks, while the SPY has been down for six of the past seven weeks. The SPY appears to lag the 10-year yield by a one to two weeks. Therefore, keep an eye for reversal candles like shooting stars and doji’s on the 10-year yield chart as a lead indicator for a potential bottom and reversal in the stock market with a one to two week lead time.
Author

Jacob Wolinsky
ValueWalk
Jacob Wolinsky is the founder of ValueWalk, a popular investment site. Prior to founding ValueWalk, Jacob worked as an equity analyst for value research firm and as a freelance writer. He lives in Passaic New Jersey with his wife and four children.