This week’s key central bank meetings have come to pass. The US Federal Reserve, the Reserve Bank of New Zealand and the Bank of Japan all decided to leave their monetary policy stances unchanged, so you would have thought that the markets would not have reacted much. Well, in the case of the Fed, you would have probably been correct since virtually no one was expecting a rate rise at this week’s meeting. The RBNZ’s decision to leave policy unchanged surprised a few people and the New Zealand dollar rallied sharply. But it was just a drop in the ocean compared to how much the yen rallied in the aftermath of the BOJ’s meeting. The latter was expected to ease its policy, especially after fresh data showed the Japanese economy fell into deflation. Not only did it refuse to do that but there wasn’t even the slightest signal of further easing. The markets have punished the BOJ by aggressively bidding up the yen.
It remains to be seen for how much longer the BOJ will be able and willing to tolerate this pain. But it may get a helping hand in the form of a stronger performance from the dollar, should the first quarter US GDP somehow beat expectations later on or next week’s employment figures surprise to the upside. In any event, the BOJ is ready to act if the situation deteriorates further, so watch out for that possibility.
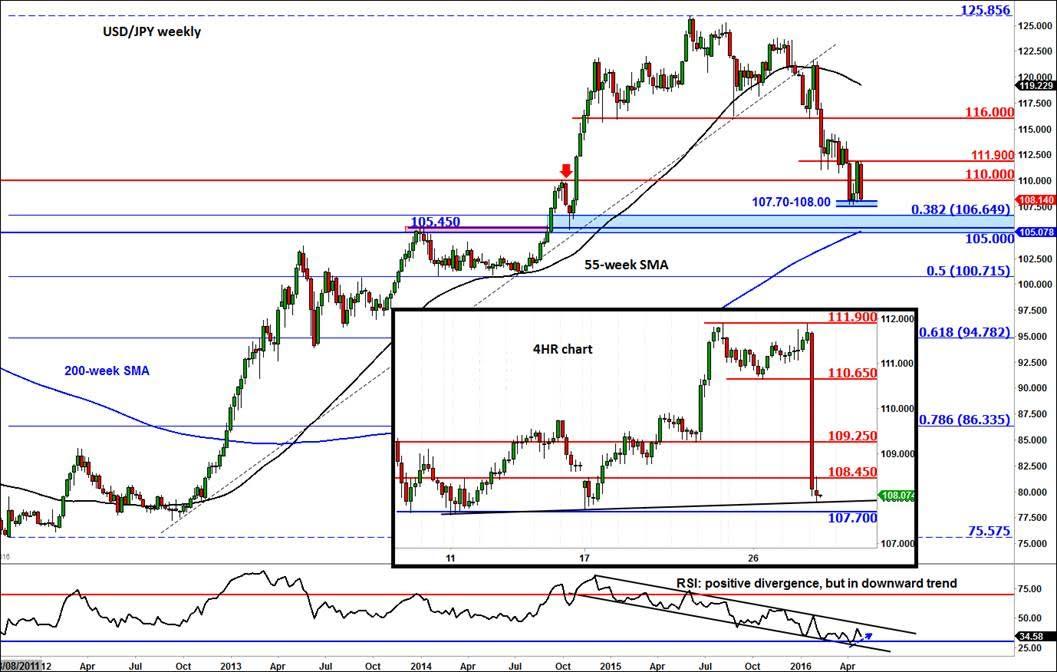
From a technical point of view, the USD/JPY charts look unsurprisingly bearish and understandably “oversold” in the short. So we may see a small short-covering bounce before the selling resumes in the coming days or weeks. In fact, the weekly chart of the USD/JPY, below, shows an uncompleted bearish engulfing candle below 110, which could complete unless US data over the next day and a half massively overshoot expectations. The engulfing candle, if seen, would paint a bleak outlook for the start of next week.
But at the time of this writing, the USD/JPY was testing the key 107.70/108.00 area after falling a massive 400 pips from near 11.90, where it may have formed a short-term double top pattern as per the 4-hour chart in the inset – the neckline of this reversal formation being at the 107.70/108.00 range. So a small rebound here should not come as a massive surprise, especially since this area marks the low from the prior three weeks. But if this support area (eventually) breaks down decisively then the USD/JPY’s downward trend may accelerate towards the support zone shaded in light blue on the chart. This area is comprised of:
106.65: long-term (shallow) 38.2% Fibonacci retracement level
105.45: previous key resistance level, which could turn into support upon re-test
105.10: the (still-rising) 200-week moving average
105.00: a psychological level
As noted, there are a number of technical factors converging in the 105.00-106.65 area, so the USD/JPY could rebound or even form a long-term base should we get there. Conversely, if this key support range also gives way then a more significant correction could be on the way, perhaps towards 100 or even lower.
Meanwhile some of the short-term resistance levels are shown on the 4-hour chart in the inset. The most important of these resistance levels are at 109.25, 110.00 and 110.65. A potential break above the double top level of 111.90 would invalidate the near-term bearish bias, in which case a rally towards the next key reference point of 116.00 could then become a good possibility.
Trading leveraged products such as FX, CFDs and Spread Bets carry a high level of risk which means you could lose your capital and is therefore not suitable for all investors. All of this website’s contents and information provided by Fawad Razaqzada elsewhere, such as on telegram and other social channels, including news, opinions, market analyses, trade ideas, trade signals or other information are solely provided as general market commentary and do not constitute a recommendation or investment advice. Please ensure you fully understand the risks involved by reading our disclaimer, terms and policies.
Recommended Content
Editors’ Picks
EUR/USD clings to gains above 1.0750 after US data

EUR/USD manages to hold in positive territory above 1.0750 despite retreating from the fresh multi-week high it set above 1.0800 earlier in the day. The US Dollar struggles to find demand following the weaker-than-expected NFP data.
GBP/USD declines below 1.2550 following NFP-inspired upsurge

GBP/USD struggles to preserve its bullish momentum and trades below 1.2550 in the American session. Earlier in the day, the disappointing April jobs report from the US triggered a USD selloff and allowed the pair to reach multi-week highs above 1.2600.
Gold struggles to hold above $2,300 despite falling US yields

Gold stays on the back foot below $2,300 in the American session on Friday. The benchmark 10-year US Treasury bond yield stays in negative territory below 4.6% after weak US data but the improving risk mood doesn't allow XAU/USD to gain traction.
Bitcoin Weekly Forecast: Should you buy BTC here? Premium

Bitcoin (BTC) price shows signs of a potential reversal but lacks confirmation, which has divided the investor community into two – those who are buying the dips and those who are expecting a further correction.
Week ahead – BoE and RBA decisions headline a calm week

Bank of England meets on Thursday, unlikely to signal rate cuts. Reserve Bank of Australia could maintain a higher-for-longer stance. Elsewhere, Bank of Japan releases summary of opinions.
