![]()
Ahead of the FOMC statement, the charts of the S&P suggest there is a possibility for a pullback in US stock markets, though at this stage there are no confirmation signs to suggest this will indeed be the case. Bullish speculators should therefore proceed with extra caution, while the conservative bears may want to wait for confirmation. The outcome of the FOMC statement and Janet Yellen’s press conference will no doubt have an impact on the foreign exchange markets, as my colleague Matt Weller wrote in his preview yesterday, HERE. For stocks, a hawkish surprise may be a negative outcome, while a surprisingly dovish tone could be positive.
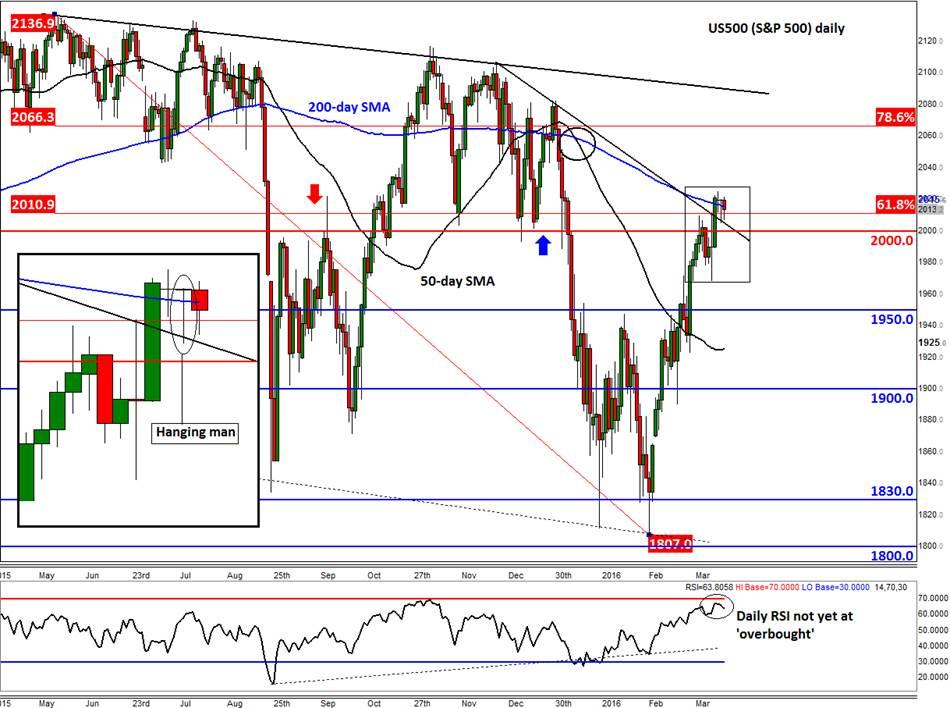
From a technical point of view, there’s no doubt that the stock market trend in recent times has been bullish – the S&P has been putting in higher highs and higher lows, with very shallow pullbacks. Several resistance levels have also broken down, including 2000 most recently. The index has now climbed above its 61.8% Fibonacci retracement against the all-time high and is trading around the 200-day moving average.
AS the daily chart shows, the 200 is still below the 50-day moving average, with the latter flattening and the former still trending lower. The daily RSI has not yet reached the ‘overbought’ threshold of 70 and the consolidation here is helping the momentum indicator to ease off from its highs without much deterioration in the underlying index. This is potentially a healthy consolidation as far as the bulls are concerned.
But the shape of the daily candlesticks over the past couple of trading sessions point to indecision. This may be a bearish scenario after a strong rally, but it is by no means a surprising outcome given that many traders have probably been sitting on their hands ahead of the Fed meeting. Nevertheless, the S&P has formed two doji candles in as many days, with the latter having the shape of a “hanging man” which is typically found at the top of the trends. The low point of yesterday’s candle was at around 2005, which is where the backside of the broken bearish trend line also converges. Thus a potential move below this level could see the index drop to the pivotal 2000 handle and if that level also fails to offer support then we may see a sharp drop in the days to come.
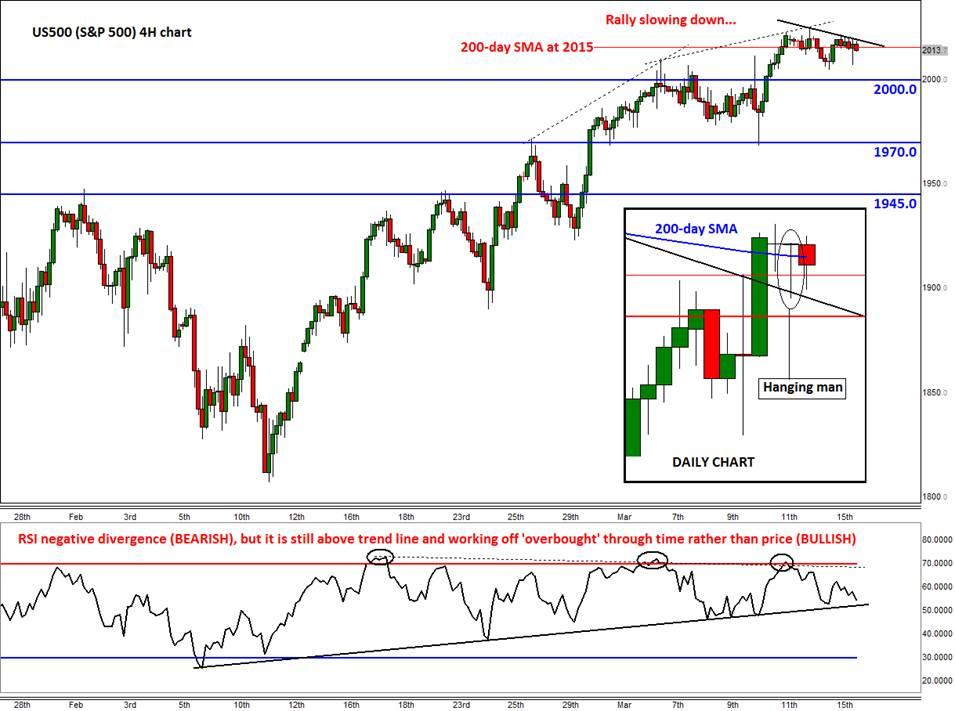
Zooming in to the smaller four hour time frame in figure 2 and it becomes more obvious that the rally is slowing down. The most recent highs have only exceeded the prior peaks marginally. Unsurprisingly, the RSI on this time frame has formed a few lower highs, creating a bearish divergence with the underlying index. However, the RSI has eased off the overbought levels (>70) mainly through time rather than price action i.e. the S&P has been consolidating rather than selling off. This is what the bulls would like to see. The RSI is also holding above its trend line and the key level of 40. However, if the indicator goes on to break below its trend line then things will start to look more bearish.
So, at this stage, neither the bulls nor the bears appear to be in full control, judging by the indecisive price action over the past couple of days. The outcome of the FOMC may cause the markets to move sharply in one or the other direction. But there’s the potential for a sharp sell-off now that the S&P’s rally has slowed down around key technical levels (200-day SMA and 61.8% Fibonacci retracement in this case). The key support levels to watch are at 2005 and 2000; the bias would turn bearish if these levels break down. Conversely, a closing break above the recent range highs of around 2020/2 would be deemed a bullish outcome. By the close of play therefore we should have a good idea about the stock market’s next move.
Trading leveraged products such as FX, CFDs and Spread Bets carry a high level of risk which means you could lose your capital and is therefore not suitable for all investors. All of this website’s contents and information provided by Fawad Razaqzada elsewhere, such as on telegram and other social channels, including news, opinions, market analyses, trade ideas, trade signals or other information are solely provided as general market commentary and do not constitute a recommendation or investment advice. Please ensure you fully understand the risks involved by reading our disclaimer, terms and policies.
Recommended Content
Editors’ Picks
EUR/USD clings to gains above 1.0750 after US data

EUR/USD manages to hold in positive territory above 1.0750 despite retreating from the fresh multi-week high it set above 1.0800 earlier in the day. The US Dollar struggles to find demand following the weaker-than-expected NFP data.
GBP/USD declines below 1.2550 following NFP-inspired upsurge

GBP/USD struggles to preserve its bullish momentum and trades below 1.2550 in the American session. Earlier in the day, the disappointing April jobs report from the US triggered a USD selloff and allowed the pair to reach multi-week highs above 1.2600.
Gold struggles to hold above $2,300 despite falling US yields

Gold stays on the back foot below $2,300 in the American session on Friday. The benchmark 10-year US Treasury bond yield stays in negative territory below 4.6% after weak US data but the improving risk mood doesn't allow XAU/USD to gain traction.
Bitcoin Weekly Forecast: Should you buy BTC here? Premium

Bitcoin (BTC) price shows signs of a potential reversal but lacks confirmation, which has divided the investor community into two – those who are buying the dips and those who are expecting a further correction.
Week ahead – BoE and RBA decisions headline a calm week

Bank of England meets on Thursday, unlikely to signal rate cuts. Reserve Bank of Australia could maintain a higher-for-longer stance. Elsewhere, Bank of Japan releases summary of opinions.

