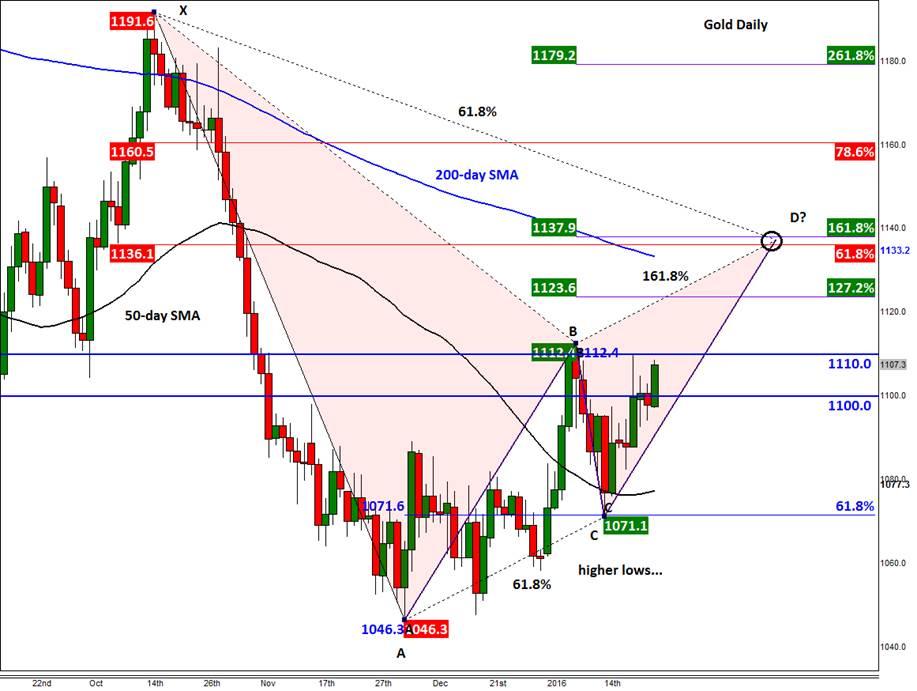
Gold has been quietly edging higher in recent weeks and today finds itself at just shy of $1110 per troy ounce. From its low point in December to the high it hit earlier this month, the metal has tacked on a good $65 or just over 6 per cent. Gold’s recovery has been driven almost exclusively by a rise in risk aversion, for the US dollar has also risen during this period. Global stocks have had their worst ever start to a year on fears about a global economic slowdown, most notably in China. At the height of the sell-off, the major global indices were down some 20% or more from their recent record or multi-year highs. When compared to the extent of the stock market’s decline, gold’s performance as a safe haven asset has therefore been poor. If stocks now manage to regain their poise then gold could quickly fall out of favour as investors unwind their safe haven trades. Nevertheless, the metal’s ability to withstand the slightly stronger performance of the US dollar cannot be ignored.
This week’s focus for gold traders, and indeed many other markets, will be the Federal Reserve meeting on Wednesday and Friday’s advance release of US GDP. Virtually no one is expecting the Fed to make any changes to monetary policy at this meeting. The key question is whether the central bank will continue its rate hiking cycle in March or postpone it until June or later. The hope is that the Fed’s policy statement will provide some clarity on this. But according to the Fed Fund Futures, the probability of a rate hike in March has fallen to below 30 per cent, which makes sense given the recent sharp rise stock market volatility and disappointing economic data. The odds for a rate increase in June are about 50 per cent. Thus if the Fed delivers a more dovish-than-expected policy statement, which would imply a later rate hike, then this should decrease the opportunity cost of holding gold. On the other hand, a more hawkish than expected statement would most likely cause gold prices to fall.
From a technical point of view, gold’s recent price action has been bullish and there may be further momentum left in its current move higher. Since hitting a fresh multi-year low of $1046 at the start of December, the metal has made a series of higher lows with the most recent one being around the 61.8% Fibonacci retracement level at $1071 in mid-January. From here, the metal has steadily risen to approach its recent range highs around $1110/12. A break above this area would probably clear the way towards $1136/8, which is where a clear Bearish Gartley pattern resides. There, the point D of an ABCD price pattern converges with the Fibonacci levels of two price swings: the 61.8% retracement of XA and 161.8% extension of BC. In addition, the 200-day moving average, at $1133/4, also resides in close proximity. Given the conflux of all these technical indicators, this is where we would expect gold to at least face some short-term resistance, should it get there in the first place. If gold breaks above here without much hesitation then it would suggest that we are in the process of a much bigger recovery. Meanwhile if gold fails to even break above the $1110/12 area and subsequently falls back decisively below $1100 then that could signal the end of the short-term bullish trend.

-------
Who were the best experts in 2015? Have your say and vote for FXStreet's Forex Best Awards 2016! Cast your vote now!
-------
Trading leveraged products such as FX, CFDs and Spread Bets carry a high level of risk which means you could lose your capital and is therefore not suitable for all investors. All of this website’s contents and information provided by Fawad Razaqzada elsewhere, such as on telegram and other social channels, including news, opinions, market analyses, trade ideas, trade signals or other information are solely provided as general market commentary and do not constitute a recommendation or investment advice. Please ensure you fully understand the risks involved by reading our disclaimer, terms and policies.
Recommended Content
Editors’ Picks
EUR/USD clings to gains above 1.0750 after US data

EUR/USD manages to hold in positive territory above 1.0750 despite retreating from the fresh multi-week high it set above 1.0800 earlier in the day. The US Dollar struggles to find demand following the weaker-than-expected NFP data.
GBP/USD declines below 1.2550 following NFP-inspired upsurge

GBP/USD struggles to preserve its bullish momentum and trades below 1.2550 in the American session. Earlier in the day, the disappointing April jobs report from the US triggered a USD selloff and allowed the pair to reach multi-week highs above 1.2600.
Gold struggles to hold above $2,300 despite falling US yields

Gold stays on the back foot below $2,300 in the American session on Friday. The benchmark 10-year US Treasury bond yield stays in negative territory below 4.6% after weak US data but the improving risk mood doesn't allow XAU/USD to gain traction.
Bitcoin Weekly Forecast: Should you buy BTC here? Premium

Bitcoin (BTC) price shows signs of a potential reversal but lacks confirmation, which has divided the investor community into two – those who are buying the dips and those who are expecting a further correction.
Week ahead – BoE and RBA decisions headline a calm week

Bank of England meets on Thursday, unlikely to signal rate cuts. Reserve Bank of Australia could maintain a higher-for-longer stance. Elsewhere, Bank of Japan releases summary of opinions.