![]()
When most FX traders think of the implications of oil prices, they think of the impact on the Canadian dollar, or if they’re of a more Northern European persuasion, perhaps the Norwegian krone. Predictably, both of those currencies have been punished amidst the ongoing collapse in oil prices, but the Russian ruble has suffered the most grievous wounds.
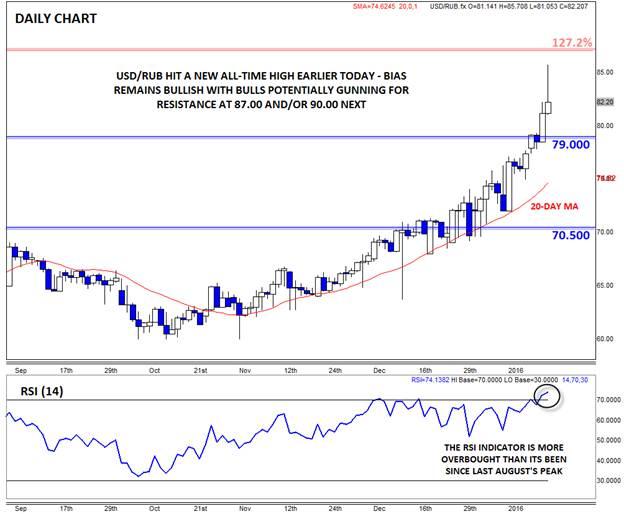
Russia’s currency fell to a new record low (since the currency was redenominated in 1998) this morning, when one US dollar could purchase more than 85 rubles. Of course, policymakers sought to downplay the move, with President Vladimir Putin's spokesman Dmitry Peskov stating, "I wouldn't use the word 'collapse.' The rate is really changing, the rate is volatile, but it's far from a collapse.” With all due respect to Mr. Peskov, when your currency loses nearly 20% of its value in less than three weeks, it’s definitely collapsing.
Though oil prices are bouncing back toward the $30.00 level (WTI) so far today, the longer-term outlook for the ruble remains dark. Earlier this week, the International Monetary Fund (IMF) published its forecast that the Russian economy would shrink an additional 1.0% this year, after contracting by fully 3.7% last year. The government’s own estimates are targeting a fiscal budget deficit of 3%, which doesn’t sound terrible until you consider that forecast is contingent on oil at $50.00/barrel, over 70% higher than yesterday’s close in WTI. Beyond the extensive economic concerns, Russia remains embroiled within testy geopolitical conflicts in the former Soviet bloc and the Middle East.
With no signs of an imminent long-term bottom in oil on the horizon, things may get a lot worse for the ruble before they get better.
Technical view: USD/RUB
Turning our attention to the chart reveals exactly what you’d expect: USD/RUB has gone parabolic over the last few weeks. While the parabolic price action is often symptomatic of a “blowoff” style top, it’s worth noting that these types of moves can run further than most traders expect, so we’d argue for caution if readers trying to stand in front of this bullish freight train and pick a top. For what it’s worth, the RSI indicator is more overbought than it’s been at any point since last August’s peak, potentially hinting at a potential buying extreme.
If we do see a near-term pullback heading into February, support may emerge at three notable levels: the previous all-time intraday high at 79.00, the 20-day MA near 75.00, and the previous closing high (before the last month) in the 70.00-50 zone. Meanwhile, another leg lower in oil (to say nothing of another geopolitical flare up) could drive USD/RUB to 127.2% Fibonacci extension resistance at 87.00, followed by the next major psychological resistance level at 90.00.
-------
Who were the best experts in 2015? Have your say and vote for FXStreet's Forex Best Awards 2016! Cast your vote now!
-------
This research is for informational purposes and should not be construed as personal advice. Trading any financial market involves risk. Trading on leverage involves risk of losses greater than deposits.
Recommended Content
Editors’ Picks
EUR/USD clings to gains above 1.0750 after US data

EUR/USD manages to hold in positive territory above 1.0750 despite retreating from the fresh multi-week high it set above 1.0800 earlier in the day. The US Dollar struggles to find demand following the weaker-than-expected NFP data.
GBP/USD declines below 1.2550 following NFP-inspired upsurge

GBP/USD struggles to preserve its bullish momentum and trades below 1.2550 in the American session. Earlier in the day, the disappointing April jobs report from the US triggered a USD selloff and allowed the pair to reach multi-week highs above 1.2600.
Gold struggles to hold above $2,300 despite falling US yields

Gold stays on the back foot below $2,300 in the American session on Friday. The benchmark 10-year US Treasury bond yield stays in negative territory below 4.6% after weak US data but the improving risk mood doesn't allow XAU/USD to gain traction.
Bitcoin Weekly Forecast: Should you buy BTC here? Premium

Bitcoin (BTC) price shows signs of a potential reversal but lacks confirmation, which has divided the investor community into two – those who are buying the dips and those who are expecting a further correction.
Week ahead – BoE and RBA decisions headline a calm week

Bank of England meets on Thursday, unlikely to signal rate cuts. Reserve Bank of Australia could maintain a higher-for-longer stance. Elsewhere, Bank of Japan releases summary of opinions.
