![]()
The pound has got its mojo back thanks to some solid UK economic data.
The construction PMI improved to 55.9 in May from 54.2 previously, easily beating the expected reading of 55.1. On top of this, the latest lending data showed a few positive surprises too. The number of mortgages taken out by individuals rose to more than 68,000 in April, which was not only better than 64,000 expected but was the highest since last February. Meanwhile, the value of mortgages was £1.9 billion in April compared to £1.8bn in March – the largest amount since November. Overall net lending to individuals totalled £2.9 billion in April versus £2.3bn expected.
Though the gains have so far been far from spectacular – with the GBP/USD so far only rising about 70 pips off its low – things could change dramatically as we progress thorough the session and the week as more sellers potentially square their positions and/or fresh buyers came into play – particularly if the key services sector PMI tops expectations on Wednesday (it is seen at 59.2 versus 59.5 in April).
Because of the dollar’s on-going rally, sterling’s underlying strength may not be plainly evident when looking at the GBP/USD currency pair. But against some of the weaker currencies, such as the JPY, the GBP does look strong. Indeed it is the GBP/JPY that we are focusing on (again) today as it tests that key 190 handle. Will it finally break higher?
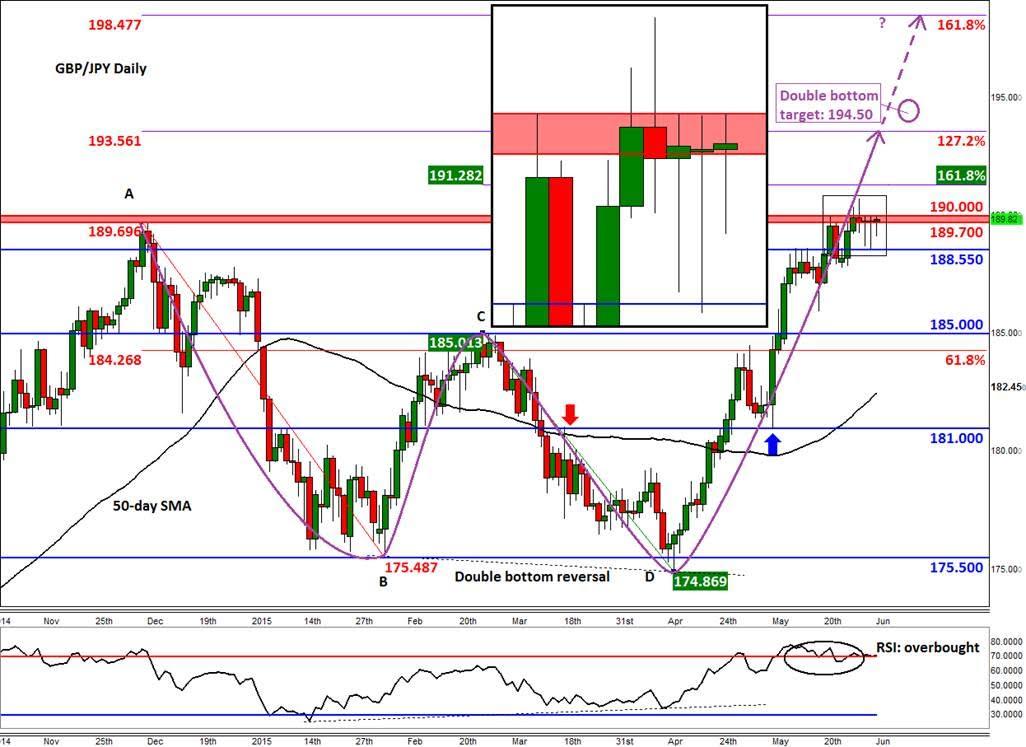
The GBP/JPY rally had stalled around the 189.70/190.00 area for a number of days recently, but the cross finally appears to be on the verge of a breakout. Price action looks decidedly bullish with the daily chart for example showing two hammer candles in as many days and prior resistance at 188.55 turning into support. If today’s UK data continues to underpin the GBP then the bulls may finally witness the breakout in the GBP/JPY that they have patiently been waiting for. A decisive break above 190.00 could target levels not seen since the financial crisis. The immediate bullish targets could be the Fibonacci extension levels shown on the chart. These include the 161.8% extension level – at just shy of 191.30 – of the last downswing we saw from point C which concluded at point D. The extension levels of the last significant downswing from point A to B come in at 193.55 (127.2%) and 198.45 (161.8%). In between the Fibonacci levels is the projected target of the double bottom pattern around 194.50. This is derived from adding the height of the pattern (i.e. 950 pips – the distance between point C and D) to the neckline at 185.00.
Although a breakout looks imminent, traders should not (or never) forget their risk management strategies as price could turn back lower at any time and without any reason (all it takes is one massive sell order or some unexpected economic announcement). It is also worth noting that the momentum indicator RSI is at overbought levels (of >70) after 7 consecutive weeks of gains. As things stand though, only a decisive break below support at 188.55 would invalidate this bullish setup. This appears less likely than for price to rally, for the reasons stated above.
Trading leveraged products such as FX, CFDs and Spread Bets carry a high level of risk which means you could lose your capital and is therefore not suitable for all investors. All of this website’s contents and information provided by Fawad Razaqzada elsewhere, such as on telegram and other social channels, including news, opinions, market analyses, trade ideas, trade signals or other information are solely provided as general market commentary and do not constitute a recommendation or investment advice. Please ensure you fully understand the risks involved by reading our disclaimer, terms and policies.
Recommended Content
Editors’ Picks
EUR/USD clings to gains above 1.0750 after US data

EUR/USD manages to hold in positive territory above 1.0750 despite retreating from the fresh multi-week high it set above 1.0800 earlier in the day. The US Dollar struggles to find demand following the weaker-than-expected NFP data.
GBP/USD declines below 1.2550 following NFP-inspired upsurge

GBP/USD struggles to preserve its bullish momentum and trades below 1.2550 in the American session. Earlier in the day, the disappointing April jobs report from the US triggered a USD selloff and allowed the pair to reach multi-week highs above 1.2600.
Gold struggles to hold above $2,300 despite falling US yields

Gold stays on the back foot below $2,300 in the American session on Friday. The benchmark 10-year US Treasury bond yield stays in negative territory below 4.6% after weak US data but the improving risk mood doesn't allow XAU/USD to gain traction.
Bitcoin Weekly Forecast: Should you buy BTC here? Premium

Bitcoin (BTC) price shows signs of a potential reversal but lacks confirmation, which has divided the investor community into two – those who are buying the dips and those who are expecting a further correction.
Week ahead – BoE and RBA decisions headline a calm week

Bank of England meets on Thursday, unlikely to signal rate cuts. Reserve Bank of Australia could maintain a higher-for-longer stance. Elsewhere, Bank of Japan releases summary of opinions.
