![]()
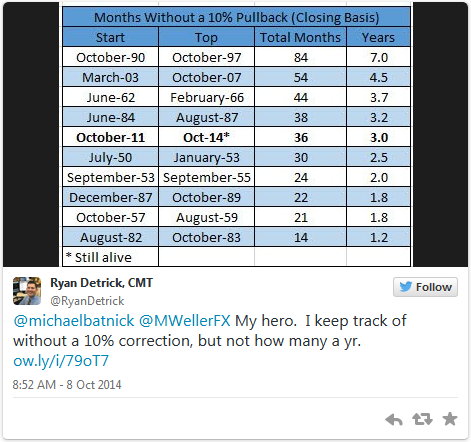
The S&P 500 stock index has now gone well over three years (since October 2011) without experiencing even a 10% correction, despite the fact that these pullbacks have occurred an average of once per year since 1928 (h/t Ben Carlson). According to trader Ryan Detrick, this is this the fifth longest such streak since 1950:
Ironically, equity investors have “lost,†or missed out on, far more value over the last few years by selling stocks in fear of a correction than they would have lost in a run-of-the-mill 10-20% correction. Despite that scary precedent, we wanted to outline eight concerning signs for the S&P 500 uptrend that suggest the long-awaited correction may be at hand:
1) The S&P 500 is Stalling
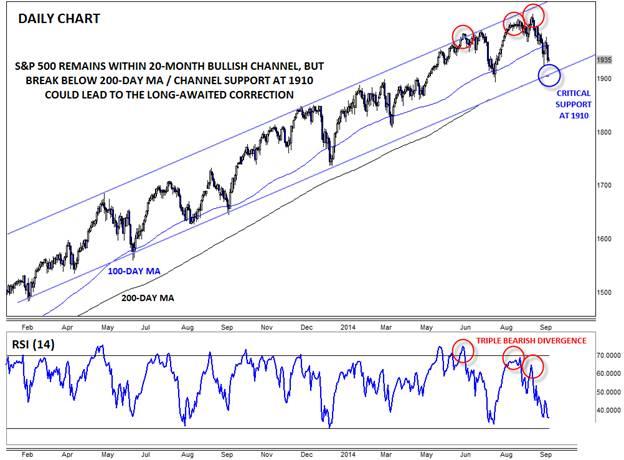
The first and most obvious potential warning sign for bulls is that the S&P 500 itself is stalling. After yesterday’s drop, the index has reached its lowest level since August, and large-cap stocks are essentially unchanged since early June. The RSI indicator, a widely-followed momentum oscillator, has also formed a triple bearish divergence at the recent highs, showing declining bullish momentum on each of the last three moves to new all-time highs (see chart at bottom).
2) The “Health†of the Uptrend is Deteriorating
Last week, we outlined a method of evaluating the “health†of an established uptrend by comparing the current price to different moving averages. While price is still within the “all-clear†zone against the 50- and 100-day moving averages, the recent weakness against the 200-day moving average could be a sign of concern. As of yesterday’s close, the S&P 500 is only about 30 points above its 200-day moving average, the lowest level since January 2013. If price breaks this relative support level against the 200-day MA, it could serve as an early warning sign of a deeper pullback
3) Small Caps and High-Yield Bonds are Trailing
From an intermarket perspective, some of the traditional leading indicators for large-cap stocks have turned lower. Last month, we outlined the relative weakness of both high-yield bonds and the Russell 2000 index, concluding that “With neither of these leading market indices confirming the recent highs in the S&P 500, the large-cap stock rally is on increasingly shaky footing†(see “Death and Taxes… and the S&P 500 Uptrend?†for more).
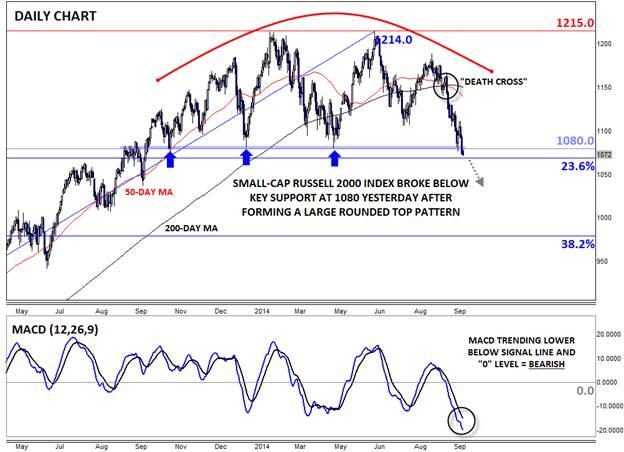
On an absolute basis, the Russell 2000 index just broke a critical level of support at 1080 to hit its lowest level in one year after carving out a large rounded top formation. The small-cap index also recently saw a “Death Cross†of the 50-day and 200-day moving averages, and the MACD is showing strongly bearish momentum. While prices could bounce off 23.6% Fibonacci retracement support at 1070 short-term, the big drop in economically-sensitive small-cap stocks bodes ill for equities as a whole.
4) Valuations are Elevated
From a fundamental perspective, stocks are more expensive than they have been at any point in the last four years. The current trailing P/E ratio for the S&P 500 is near 19, its highest level since April 2010, and longer-term valuation measures, such as the Shiller P/E and Q ratios, are even more stretched. Of course, bulls would argue that the higher valuations are warranted based on the improving economic picture, but the current valuations certainly allow less margin for error than back in mid-2011, when trailing P/E ratios were closer to 14.
5) Earnings Estimates are Falling
Alcoa officially kicks off the always-volatile earnings season after the bell today, and while decent earnings are expected once again, optimism has been waning over the last few months. According to data from Bloomberg, S&P 500 earnings are expected to increase by 4.9% this quarter, down from estimates of a 7.8% increase back in July. Slowing earnings growth, combined with elevated P/E ratios, could turn out to be a fundamental cocktail for a deeper drop in the S&P 500.
6) King Dollar is Hurting Foreign Profits
One big concern for large-cap stocks is the recent strength in the US Dollar. The companies that make up the S&P 500 index derive nearly half of their revenue from foreign sources, and the recent strength of the buck makes those products and services more expensive for foreigners. Yesterday, we highlighted the unprecedented streak of 12 consecutive bullish weeks in the dollar index and made the case for continued strength over the course of Q4 (see Greenback: Blue Skies Ahead? for more).
7) The End of Quantitative Easing
The proverbial “Elephant in the Room†throughout the S&P 500’s rally has been the Federal Reserve’s Quantitative Easing program, which has injected trillions of dollars into the world’s financial system over the last few years. Inevitably, much of this money found its way into stocks, but with the Fed all-but-certain to pull the plug on QE later this month (and start raising interest rates at some point in H1 2015) a major monetary tailwind for the equity rally is dying down.
8) Global Growth Estimates Falling
Finally, just last night, the International Monetary Fund (IMF) cut its estimates of global growth for the third time this year. The supranational organization trimmed its global growth outlook for 2014 to 3.3% (from 3.4% in July) and 2015 to 3.8% (from 4.0% in July). While US growth is still seen as generally strong, lower growth from the Eurozone, Japan, and major emerging markets could still hurt the profits of large US companies.
Of course, at the end of the day, the most important technical indicator is price, and the S&P 500 still remains within its 20-month bullish channel. In time, the current price action may simply turn out to be a healthy consolidation within the uptrend like we saw in Q1 of this year.
However, the eight concerns outlined above suggest bullish traders should be on edge, especially as the S&P 500 approaches critical support at 1910, the bottom of the channel and the 200-day moving average. If this level breaks, the long-awaited pullback may finally be at hand.
This research is for informational purposes and should not be construed as personal advice. Trading any financial market involves risk. Trading on leverage involves risk of losses greater than deposits.
Recommended Content
Editors’ Picks
EUR/USD clings to gains above 1.0750 after US data

EUR/USD manages to hold in positive territory above 1.0750 despite retreating from the fresh multi-week high it set above 1.0800 earlier in the day. The US Dollar struggles to find demand following the weaker-than-expected NFP data.
GBP/USD declines below 1.2550 following NFP-inspired upsurge

GBP/USD struggles to preserve its bullish momentum and trades below 1.2550 in the American session. Earlier in the day, the disappointing April jobs report from the US triggered a USD selloff and allowed the pair to reach multi-week highs above 1.2600.
Gold struggles to hold above $2,300 despite falling US yields

Gold stays on the back foot below $2,300 in the American session on Friday. The benchmark 10-year US Treasury bond yield stays in negative territory below 4.6% after weak US data but the improving risk mood doesn't allow XAU/USD to gain traction.
Bitcoin Weekly Forecast: Should you buy BTC here? Premium

Bitcoin (BTC) price shows signs of a potential reversal but lacks confirmation, which has divided the investor community into two – those who are buying the dips and those who are expecting a further correction.
Week ahead – BoE and RBA decisions headline a calm week

Bank of England meets on Thursday, unlikely to signal rate cuts. Reserve Bank of Australia could maintain a higher-for-longer stance. Elsewhere, Bank of Japan releases summary of opinions.


