![]()
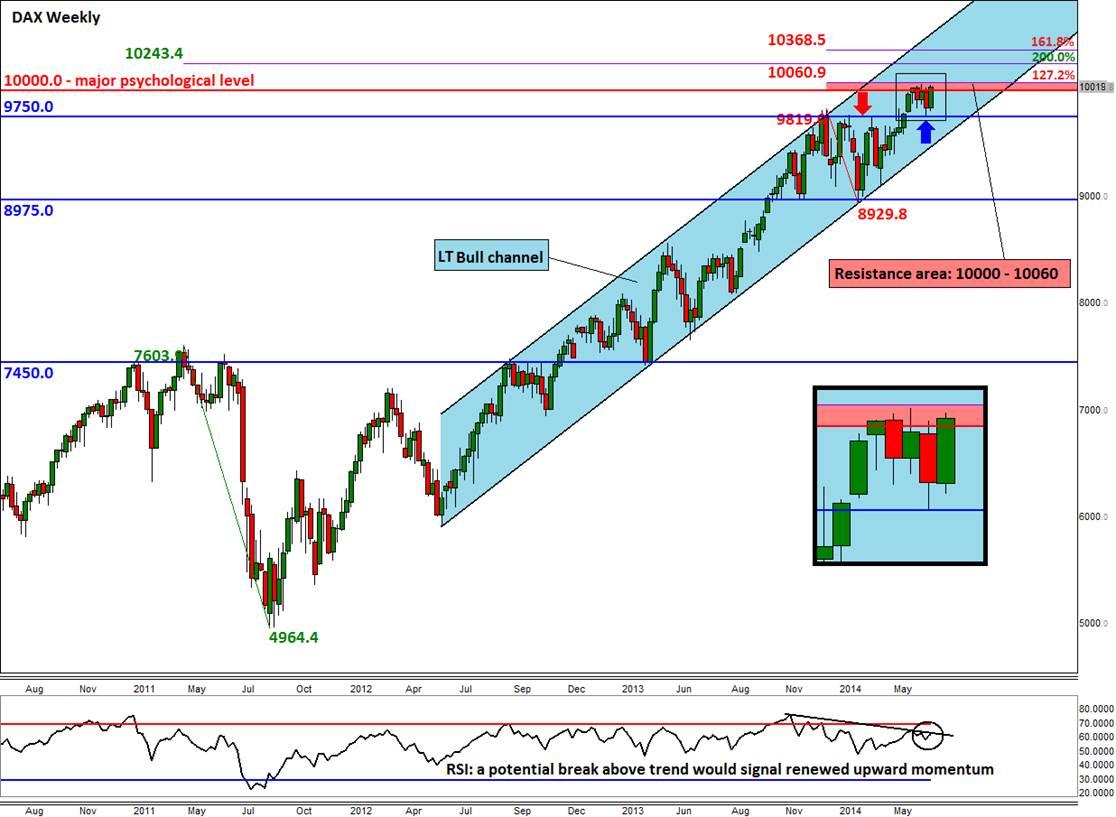
The long-term chart of the DAX is looking very impressive. The German index has been climbing inside a bullish channel for two years now and there are few signs to suggest this trend is going to end any time soon. Admittedly, it has struggled to advance significantly beyond the 10,000 barrier in recent weeks. But this should not come as a major surprise to anyone for 10,000 is a key psychological level, above all.
I would imagine many market participants had been thinking of at least reducing their longs around this 10,000 area while other would-be bullish speculators, who were anticipating this, probably have stayed on the side-lines until they see a clear breakout. Currently, resistance is being offered between 10,000 and 10,060. While the lower end of this range is as mentioned a psychological level, the upper end corresponds with the 127.2% Fibonacci extension level of the corrective move we saw between January and March this year. A potential break above this range would thus be another bullish development, which could see the index soar to fresh record levels.
Although the week hasn’t ended yet, the large bullish candlestick pattern that is being displayed on the chart suggests the DAX could potentially break higher as early as next week. The Relative Strength Index (RSI) is currently above the key 60 area, confirming we are in an overall uptrend. While the RSI is currently in a state of a bearish divergence (i.e. the DAX has created a higher high, while in contrast the RSI has made a lower high), it is also on the verge of potentially breaking its corrective trend. If the RSI does break the trend, it would thus signal renewed upward momentum.
Meanwhile if and when the underlining DAX index breaks above the aforementioned resistance area, then it may be worth keeping an eye on a couple of long-term exhaustion areas around 10240/5 and 10365/70. The former corresponds with the 200% extension level of the correction we saw in 2011 (when the index dropped from a high of about 7600 to a low of 4965), while the latter ties in with the 161.8% Fibonacci extension level of the January-March 2014 downswing. There are obviously several other Fibonacci extension levels of smaller price swings as well as other technical levels that are not shown on this chart which may also offer resistance.
Trading leveraged products such as FX, CFDs and Spread Bets carry a high level of risk which means you could lose your capital and is therefore not suitable for all investors. All of this website’s contents and information provided by Fawad Razaqzada elsewhere, such as on telegram and other social channels, including news, opinions, market analyses, trade ideas, trade signals or other information are solely provided as general market commentary and do not constitute a recommendation or investment advice. Please ensure you fully understand the risks involved by reading our disclaimer, terms and policies.
Recommended Content
Editors’ Picks
EUR/USD clings to gains above 1.0750 after US data

EUR/USD manages to hold in positive territory above 1.0750 despite retreating from the fresh multi-week high it set above 1.0800 earlier in the day. The US Dollar struggles to find demand following the weaker-than-expected NFP data.
GBP/USD declines below 1.2550 following NFP-inspired upsurge

GBP/USD struggles to preserve its bullish momentum and trades below 1.2550 in the American session. Earlier in the day, the disappointing April jobs report from the US triggered a USD selloff and allowed the pair to reach multi-week highs above 1.2600.
Gold struggles to hold above $2,300 despite falling US yields

Gold stays on the back foot below $2,300 in the American session on Friday. The benchmark 10-year US Treasury bond yield stays in negative territory below 4.6% after weak US data but the improving risk mood doesn't allow XAU/USD to gain traction.
Bitcoin Weekly Forecast: Should you buy BTC here? Premium

Bitcoin (BTC) price shows signs of a potential reversal but lacks confirmation, which has divided the investor community into two – those who are buying the dips and those who are expecting a further correction.
Week ahead – BoE and RBA decisions headline a calm week

Bank of England meets on Thursday, unlikely to signal rate cuts. Reserve Bank of Australia could maintain a higher-for-longer stance. Elsewhere, Bank of Japan releases summary of opinions.
