![]()
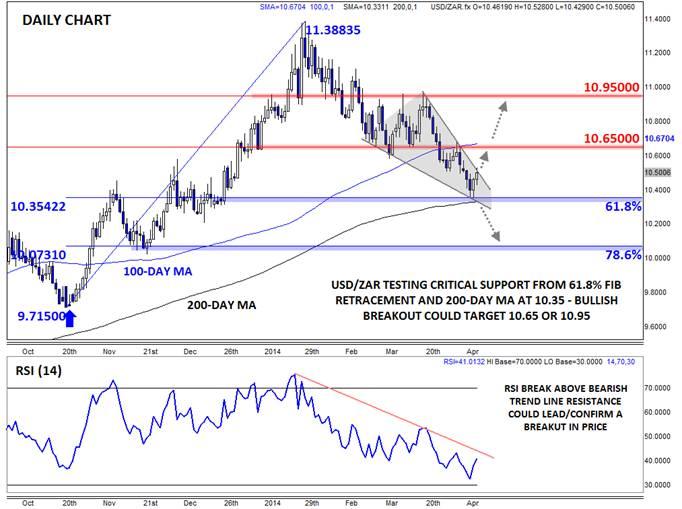
Earlier this week, the South African rand quietly rallied to a new 2014 high against the US dollar, extending the trend seen since the USD/ZAR peaked near 11.40 back in late January. While USD/ZAR traders have been able to consistently shrug off negative South African data over the last two months, the pair is showing nascent signs of bottoming off a critical support level on the daily chart.
From a fundamental perspective, the unit was hit with a 1-2 punch of negative economic data over the last 24 hours. First, a report from South Africa’s critical mining sector showed that mining production fell 7.0% in February, after a negatively-revised 3.7% drop in January. This weak figure was driven by a staggering 18% decline in platinum production, primarily as a result of the ongoing strikes in the sector, which are now entering their 11th week.
The second hit came from the February Manufacturing Production report, which fell by 1.9% after rising 0.5% the previous month; like with the mining production report, the January Manufacturing report was also revised lower. After these weak reports, some analysts are speculating that the rapid deceleration in the mining and manufacturing sectors could shave over 1% from Q1 GDP in South Africa.
The technical picture, on the other hand, is a bit more mixed. The USD/ZAR has bounced modestly off strong converging support at the convergence of the 200-day MA and 61.8% daily Fibonacci retracement over the last few days, but rates remain trapped within a possible 6-week falling wedge pattern. As a reminder, this tends to be a bullish pattern that shows declining selling momentum on each additional thrust lower.
Nonetheless, bullish traders may still want to exercise caution as long as the pair continues to put in lower lows and lower highs. One early signal of a possible change in trend could come if the RSI breaks above its descending trend line. Whether this occurs before or after a breakout in price itself, it would strengthen our conviction that the trend had changed.
To the topside, a breakout from the falling wedge pattern may initially target previous-support-turned-resistance at 10.65, which also converges with the 100-day MA. Above that barrier, a possible run back toward the March highs at 10.95 may be seen next. To the downside, a conclusive break below the key 10.35 floor would suggest that the pair may have further to fall, regardless of any economic data, and may expose the 78.6% Fibonacci retracement near 10.00 even in the weeks to come.
This research is for informational purposes and should not be construed as personal advice. Trading any financial market involves risk. Trading on leverage involves risk of losses greater than deposits.
Recommended Content
Editors’ Picks
EUR/USD clings to gains above 1.0750 after US data

EUR/USD manages to hold in positive territory above 1.0750 despite retreating from the fresh multi-week high it set above 1.0800 earlier in the day. The US Dollar struggles to find demand following the weaker-than-expected NFP data.
GBP/USD declines below 1.2550 following NFP-inspired upsurge

GBP/USD struggles to preserve its bullish momentum and trades below 1.2550 in the American session. Earlier in the day, the disappointing April jobs report from the US triggered a USD selloff and allowed the pair to reach multi-week highs above 1.2600.
Gold struggles to hold above $2,300 despite falling US yields

Gold stays on the back foot below $2,300 in the American session on Friday. The benchmark 10-year US Treasury bond yield stays in negative territory below 4.6% after weak US data but the improving risk mood doesn't allow XAU/USD to gain traction.
Bitcoin Weekly Forecast: Should you buy BTC here? Premium

Bitcoin (BTC) price shows signs of a potential reversal but lacks confirmation, which has divided the investor community into two – those who are buying the dips and those who are expecting a further correction.
Week ahead – BoE and RBA decisions headline a calm week

Bank of England meets on Thursday, unlikely to signal rate cuts. Reserve Bank of Australia could maintain a higher-for-longer stance. Elsewhere, Bank of Japan releases summary of opinions.
