Housing Peaked May of 2018: Cycle Trends Suggest Long, Weak Recovery is Over

Housing starts are down 4% in July. Permits are up 8.4%.
Housing Starts Dive Led by Multi-Family, Revisions Negative
Housing starts are down 4% in July with multi-family down 17.2% and single-family up 1.3%. Permits are up 8.4%.
Let's step back and make sense of it all.
Expect Revisions
My first thought at looking at the Census Bureau's New Residential Construction Report for July is a frequent one:. Expect revisions.
Here are the key numbers, soon to be revised, and perhaps hugely so.
Building Permits
Privately‐owned housing units authorized by building permits in July were at a seasonally adjusted annual rate of 1,336,000. This is 8.4 percent above the revised June rate of 1,232,000 and is 1.5 percent above the July 2018 rate of 1,316,000. Single‐family authorizations in July were at a rate of 838,000; this is 1.8 percent above the revised June figure of 823,000. Authorizations of units in buildings with five units or more were at a rate of 453,000 in July.
Housing Starts
Privately‐owned housing starts in July were at a seasonally adjusted annual rate of 1,191,000. This is 4.0 percent below the revised June estimate of 1,241,000, but is 0.6 percent above the July 2018 rate of 1,184,000. Single‐family housing starts in July were at a rate of 876,000; this is 1.3 percent above the revised June figure of 865,000. The July rate for units in buildings with five units or more was 303,000.
Housing Completions
Privately‐owned housing completions in July were at a seasonally adjusted annual rate of 1,250,000. This is 7.2 percent above the revised June estimate of 1,166,000 and is 6.3 percent above the July 2018 rate of 1,176,000. Single‐family housing completions in July were at a rate of 918,000; this is 4.3 percent above the revised June rate of 880,000. The July rate for units in buildings with five units or more was 321,000.
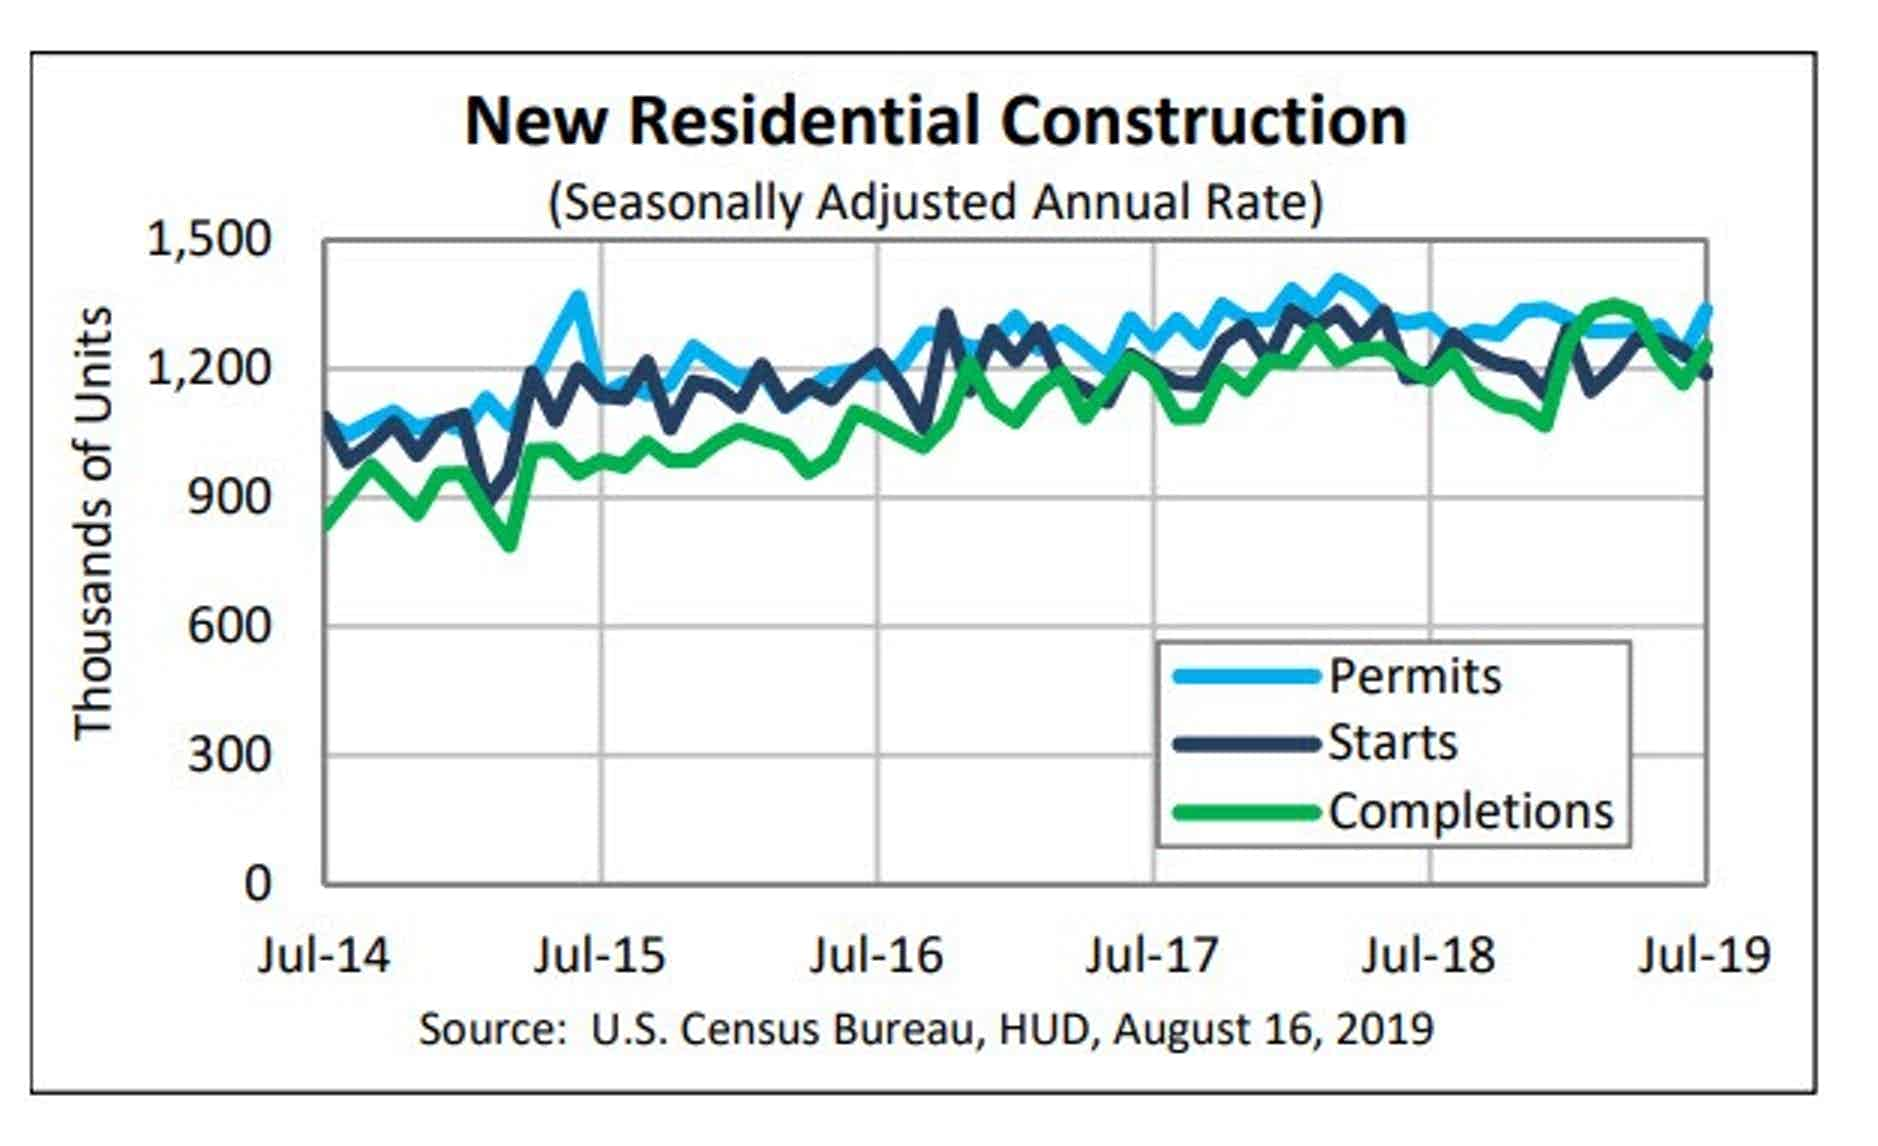
Housing Starts Seasonally Adjusted
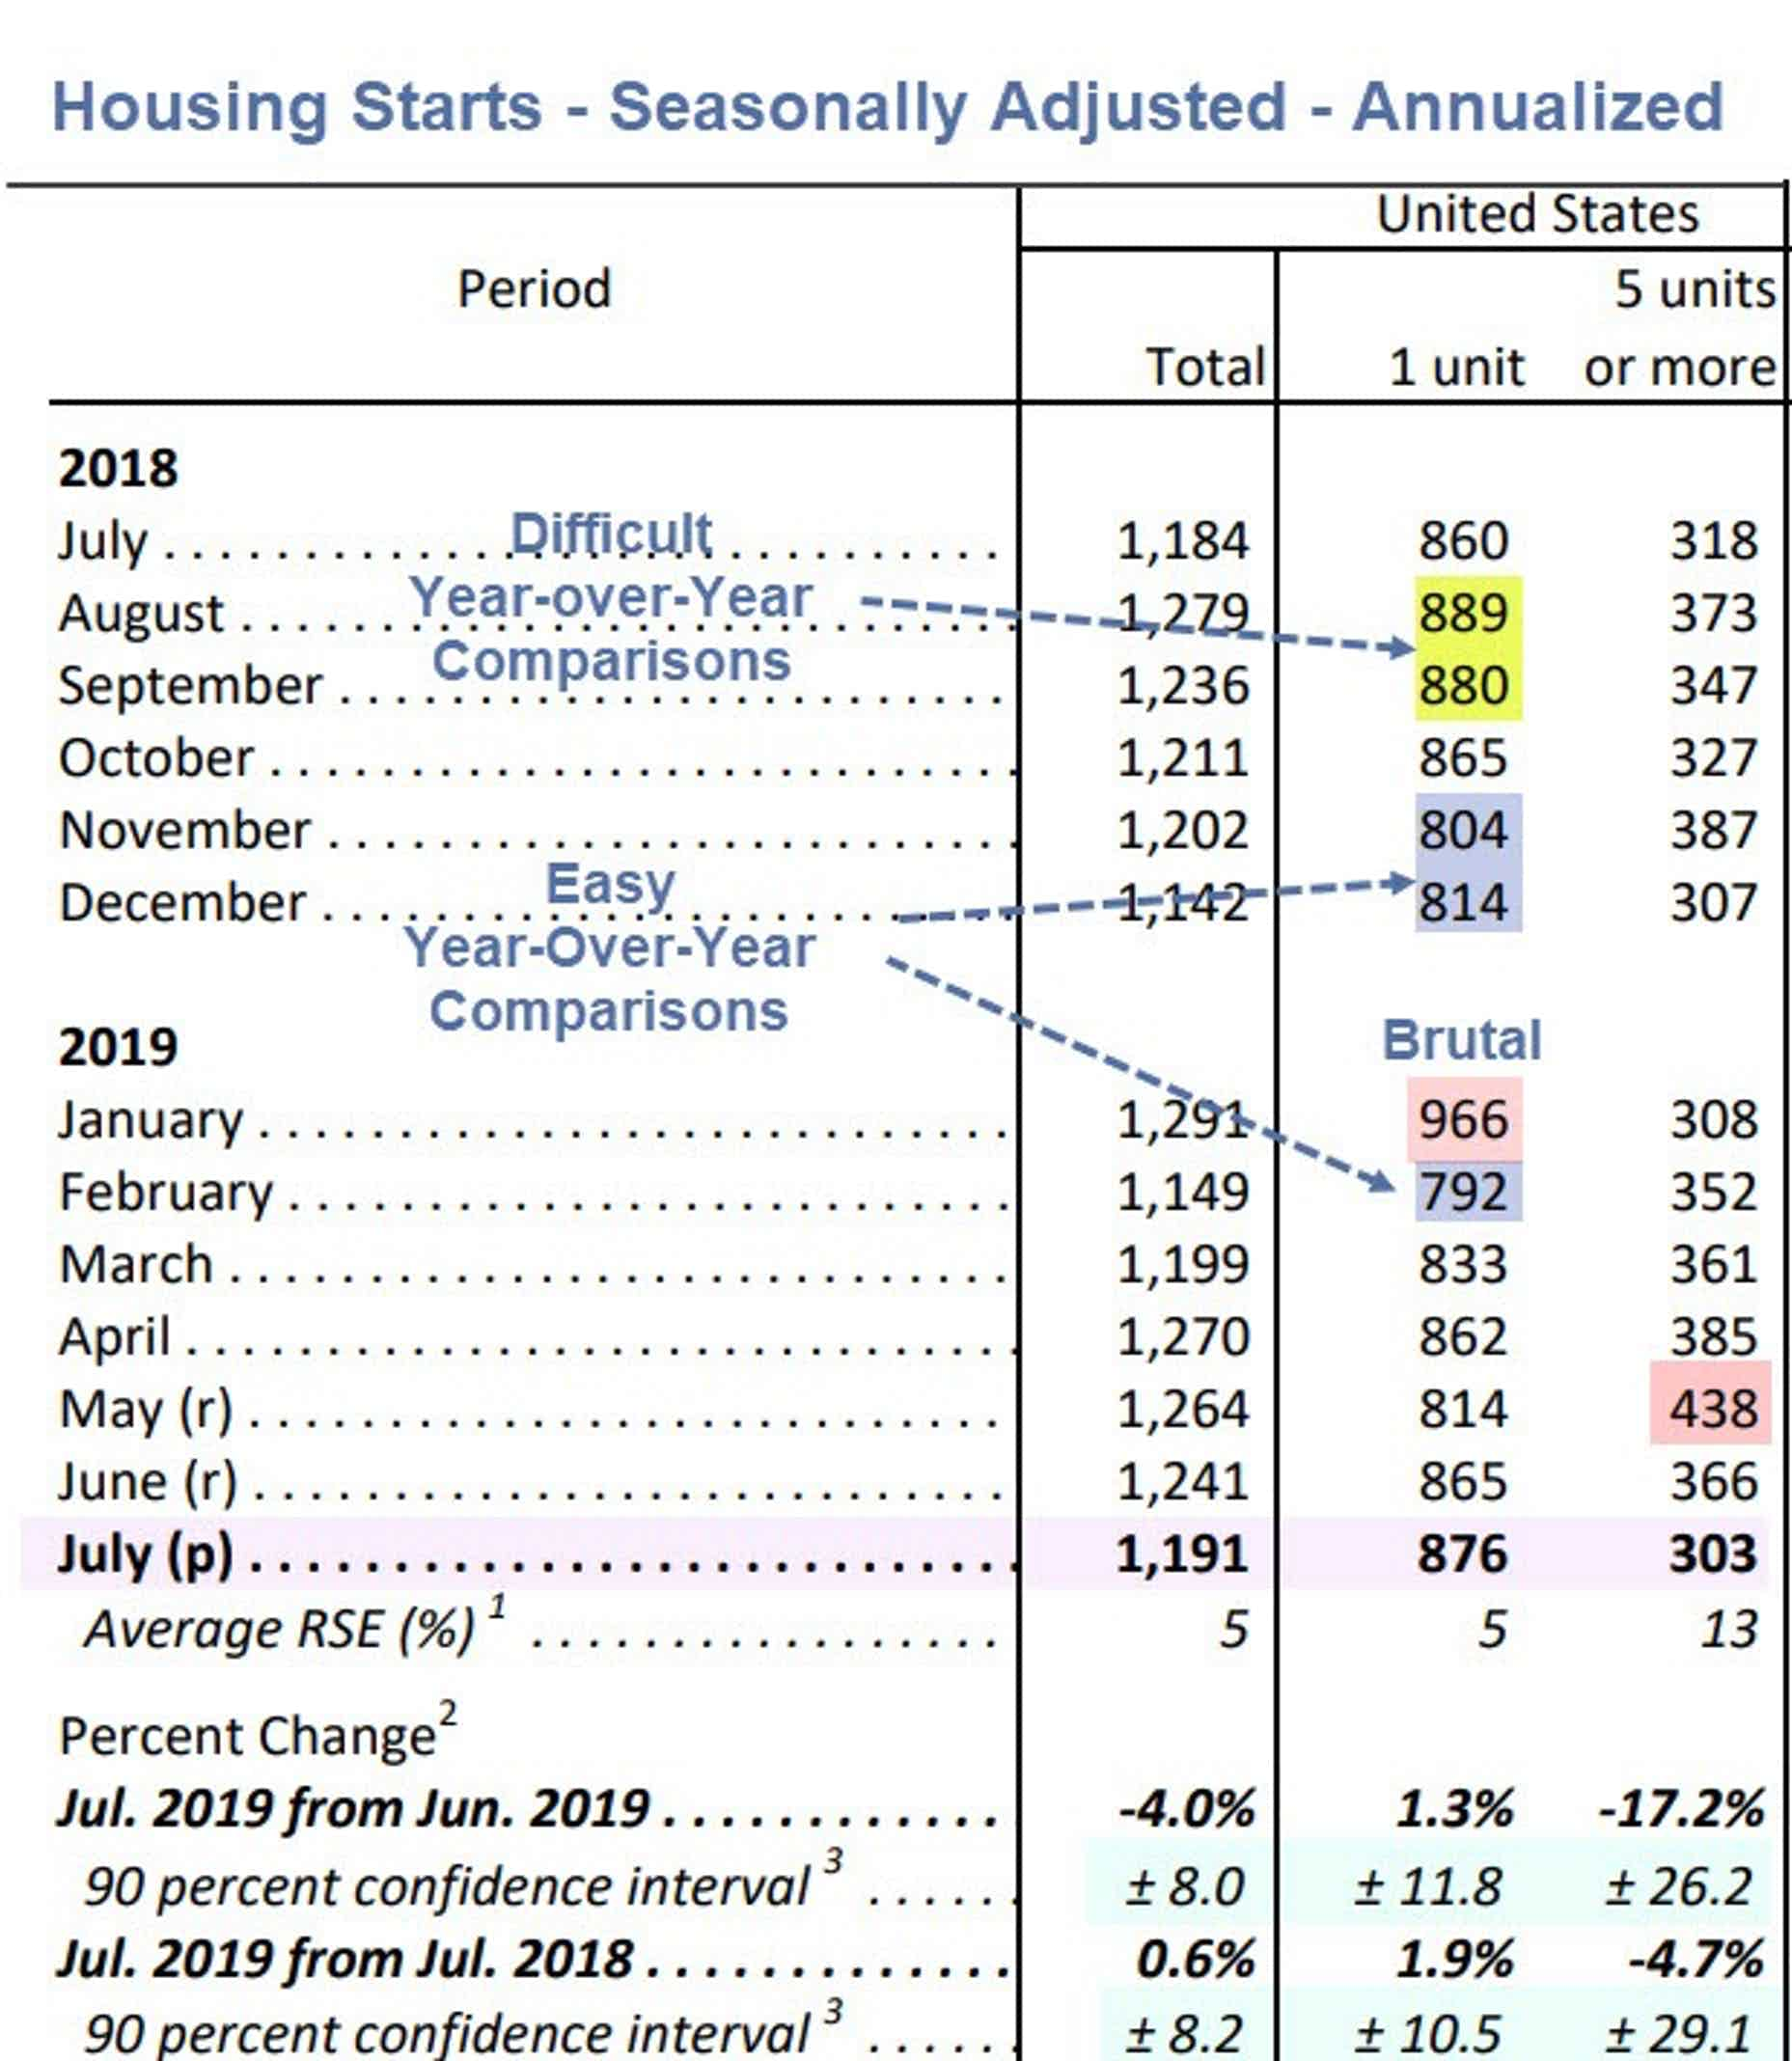
Deceptive Year-Over-Year Totals
The year-over-year single-family numbers look OK but July of 2018 offered a relatively easy comparison.
August and September will provide much harder comparisons.
Then November and December will provide extremely easy comparisons following by January of 2019 with an extremely difficult year-over-year comparison.
Confidence Ranges
- Single-family housing starts are -4.0% with a confidence range of +- 8.0%.
- Multi-family housing starts are -17.2% with a confidence range of +- 26.2%
- Year-over-year multi-family housing starts are -4.7% with a confidence range of +- 29.1%
That's a close as it gets and that's why we have huge revisions. Year-over-year comparisons make little sense with this kind of setup.
Big Picture
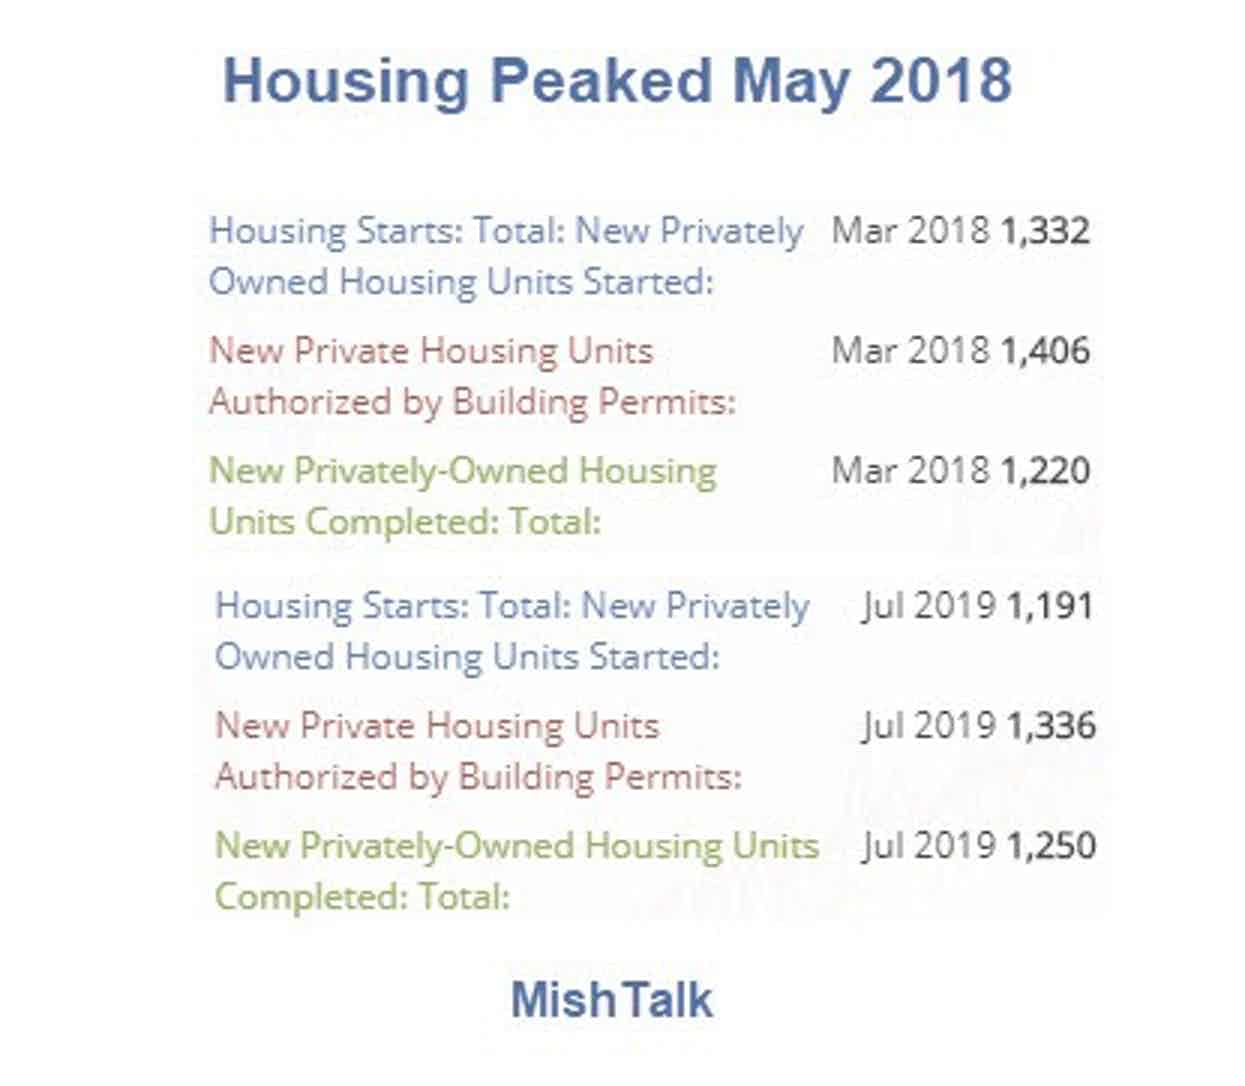
Housing Peaked May 2018
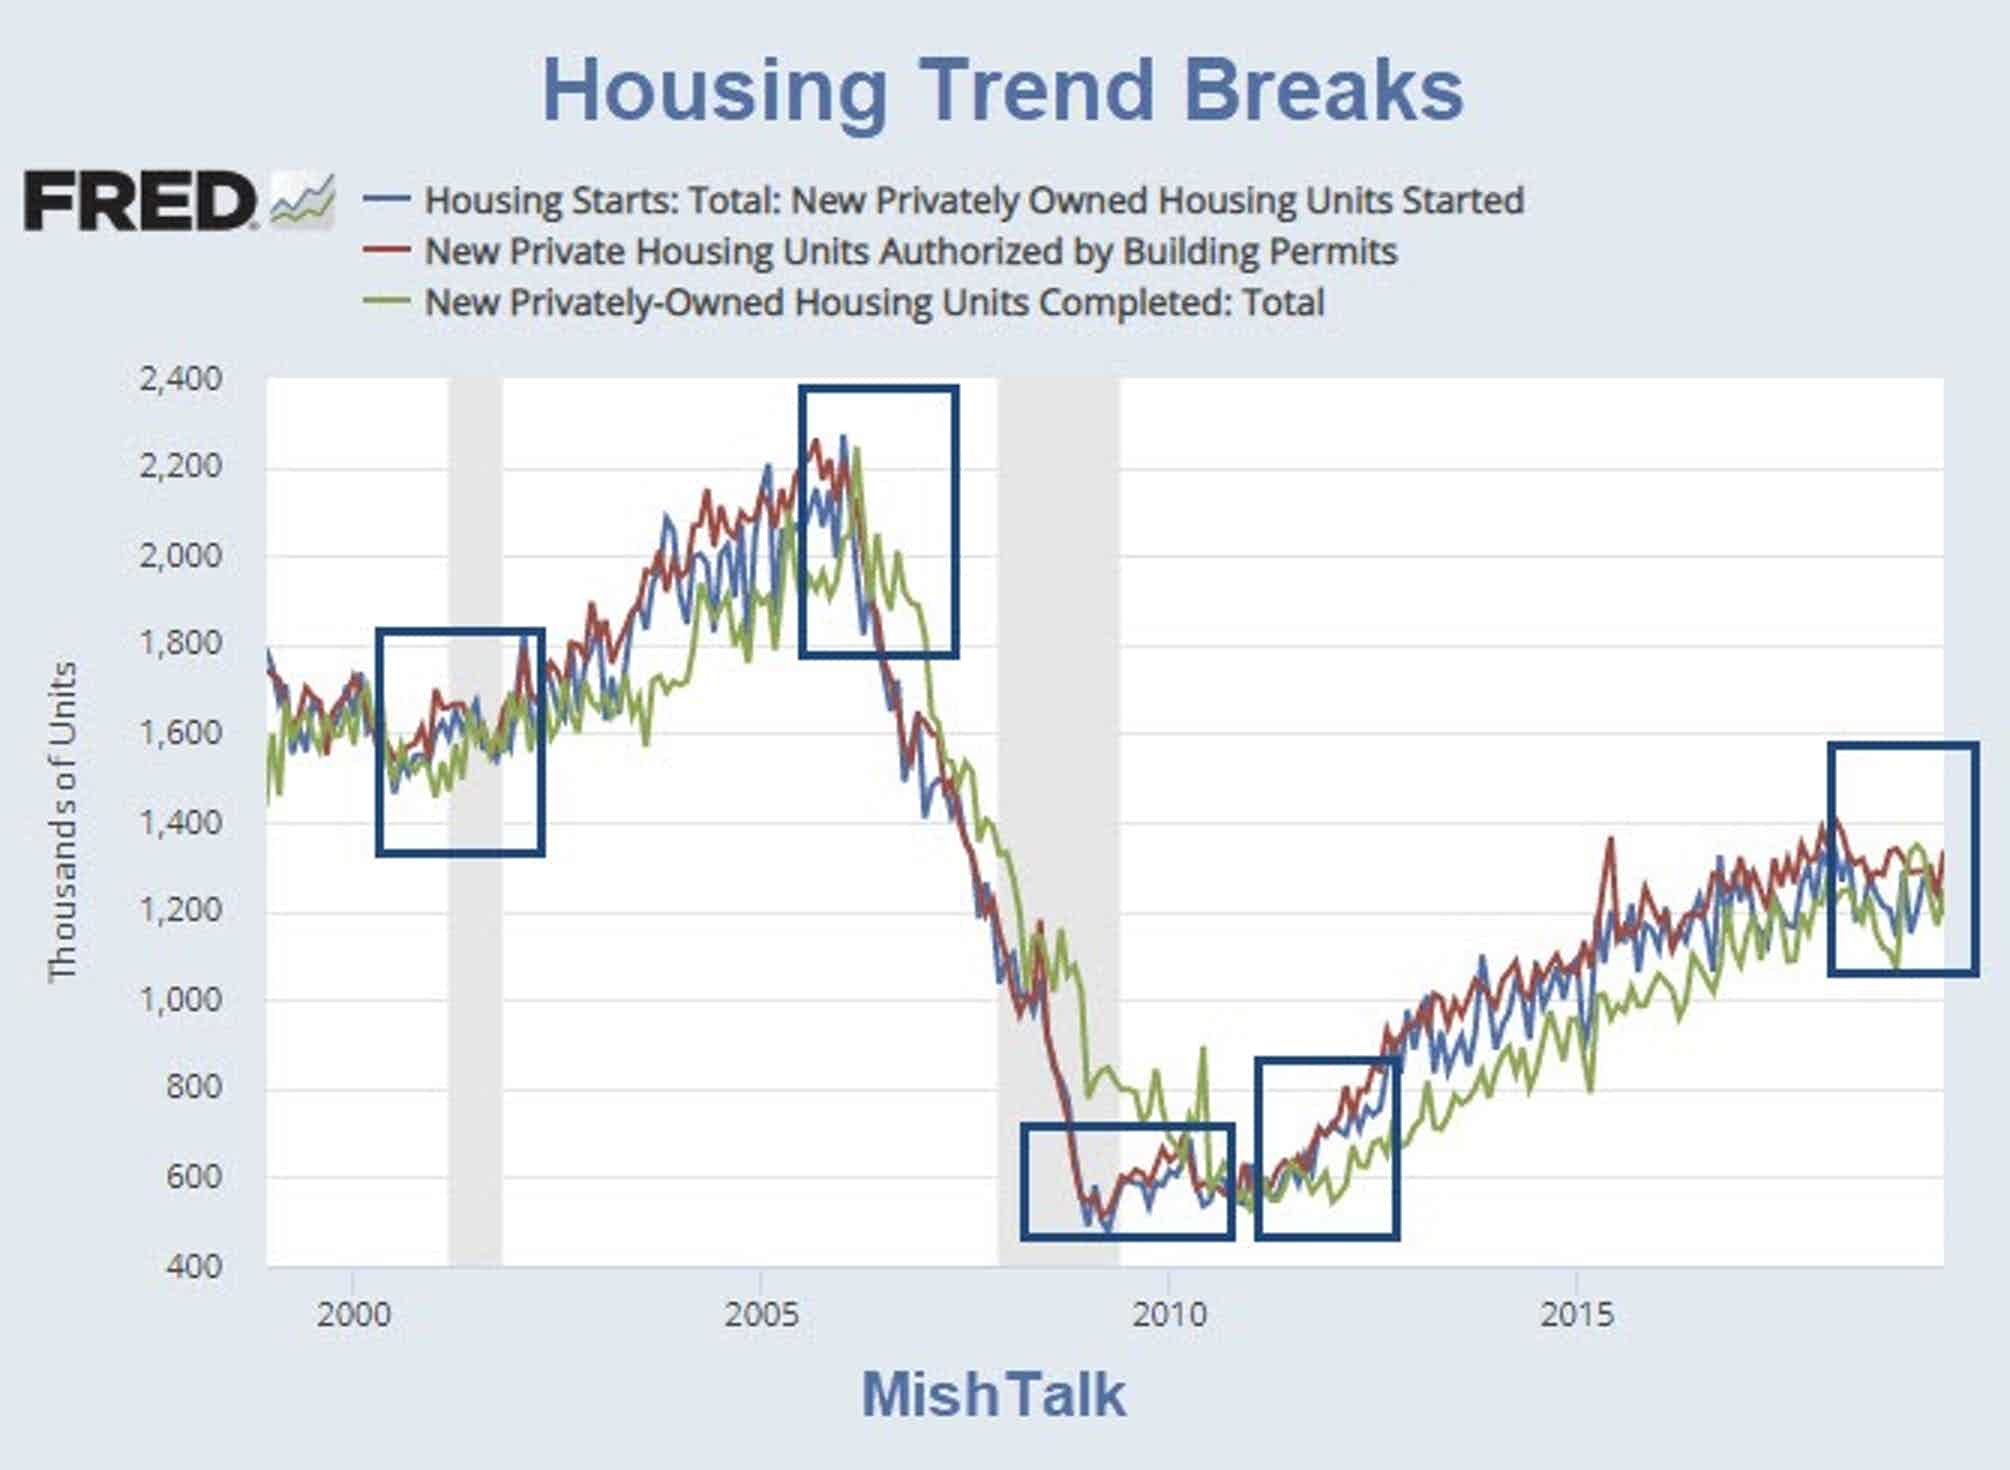
Trend Breaks
Paying too much attention to results month-over-month or even year-over-year is a mistake.
The Census Bureau chart at the top provides little information. Only by stepping back can one spot the trend breaks.
Long, Weak Trend
This was a long housing cycle trend, but also a very weak one.
- Housing Starts Feb 1959: 1,667
- Housing Starts Jul 2019: 1,191
Housing starts in July of 2019 are 41% below the level in February of 1959.
Trends Don't Predict
The trend does not say it will continue or not.
But the economy is clearly slowing and houses are not affordable.
Lower interest rates do not make houses affordable. Over-paying is still over-paying.
Fundamental Factors
- Demographics are hugely unfavorable for much home building. Boomers are retiring and want to downsize.
- Millennials taking care of their aging parents and will eventually inherit those homes.
- Homes are not affordable. Wages have not kept up with home prices.
- Student loan debt
- Global economy is slowing
- Attitudes towards home ownership have changed.
- Interest rates are lower - The single positive
Real estate agents will always tell you "There's no better time to buy", but the fundamentals suggest this is a poor time to buy.
Author

Mike “Mish” Shedlock's
Sitka Pacific Capital Management,Llc


