Gold Weekly Forecast: Key data releases from China, US could help XAU/USD find direction
- Gold struggled to make a decisive move in either direction this week.
- XAU/USD defines a consolidation range before the next breakout.
- US inflation and Chinese trade data could ramp up Gold’s volatility next week.

Gold (XAU/USD) opened in a calm manner on Monday and spent the rest of the week fluctuating in a narrow channel at around $2,650. Trade Balance data from China and November inflation figures from the United States could help XAU/USD break out of its trading range next week.
Gold suffers heavy losses on improving risk mood
Following the indecisive action seen in the second half of the previous week, Gold’s choppy action continued. In the absence of fresh developments surrounding geopolitics, XAU/USD ignored the US macroeconomic events and fluctuated in a tight channel in the first half of the week. Additionally, the benchmark 10-year US Treasury bond yield stabilized at around 4.2% after losing about 5% last week, making it even more difficult for Gold to find direction.
On Monday, the data from the US showed that the ISM Manufacturing Purchasing Managers Index (PMI) improved to 48.4 in November from 46.5 in October. The US Bureau of Labor Statistics reported on Tuesday that JOLTS Job Openings rose to 7.74 million in October from 7.37 in September.
While participating in a moderated discussion at the New York Times DealBook Summit on Wednesday, Federal Reserve (Fed) Chairman Jerome Powell reiterated that the US economy is in good shape. “The Fed is trying to be in a middle place where policy is less restrictive, so inflation can fall but not damage the labor market,” he added. Also on Wednesday, Automatic Data Processing (ADP) announced that employment in the private sector rose by 146,000 in November and the ISM reported that the Services PMI declined to 52.1 in November from 56 in October.
The US Bureau of Labor Statistics reported on Friday that Nonfarm Payrolls (NFP) rose by 227,000 in November. This reading followed the 36,000 increase recorded in October and surpassed the market expectation of 200,000. The underlying details of the data showed that the Unemployment Rate edged higher to 4.2%, while the annual wage inflation held steady at 4%. Despite the upbeat data, the USD struggled to gather strength, allowing XAU/USD to remain within its weekly range.
Assessing Gold’s recent valuation, “Gold's performance stemmed from a wild swing in investor positioning - morphing from underinvested at the start of the year to an extreme position size by US election night; alongside extreme physical market buying activity in the first half of the year, underscored by strong central bank increases,” said TD Securities Senior Commodity Strategist Daniel Ghali.
“Tailwinds from many of these underlying drivers have subsided. Following brief but significant liquidations, macro funds have reacquired a significant portion of their extreme position size, leading to renewed positioning vulnerabilities. And, this time around, a continued downtape,” Ghali added.
Gold investors shift focus to US, Chinese data
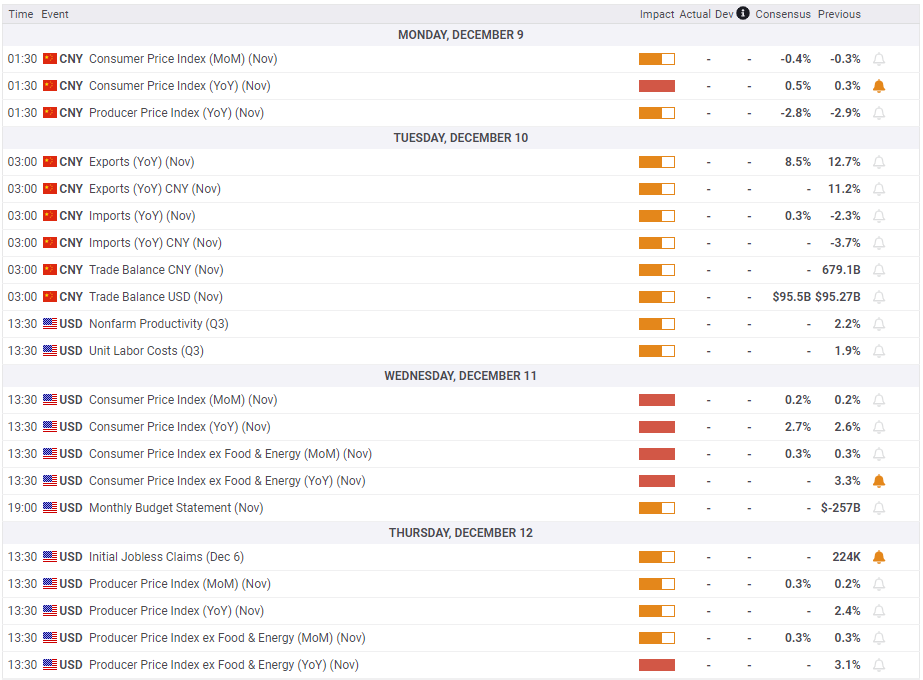
November Trade Balance data from China will be watched closely by market participants in the Asian session on Tuesday as investors grow increasingly concerned about the potential negative impact of US President-elect Donald Trump’s tariffs on the Chinese economic outlook. Hence, a noticeable increase in trade surplus could provide a short-term relief and help Gold edge higher with the immediate reaction.
On Wednesday, the US BLS will publish the Consumer Price Index (CPI) figures for November. On a monthly basis, the core CPI, which excludes volatile food and energy prices, is forecast to rise 0.3%, at the same pace it did in October. A reading of 0.5% or higher could revive fears over a pickup in inflation. In this scenario, the immediate reaction is likely to trigger a leg higher in US T-bond yields and weigh on Gold. On the flip side, a soft print of 0.3% or lower could have the opposite impact on XAU/USD’s action.
Since the Fed will be next week in the blackout period ahead of the December 17-18 policy meeting, investors will not have any comments from Fed officials to assess.
Gold technical outlook
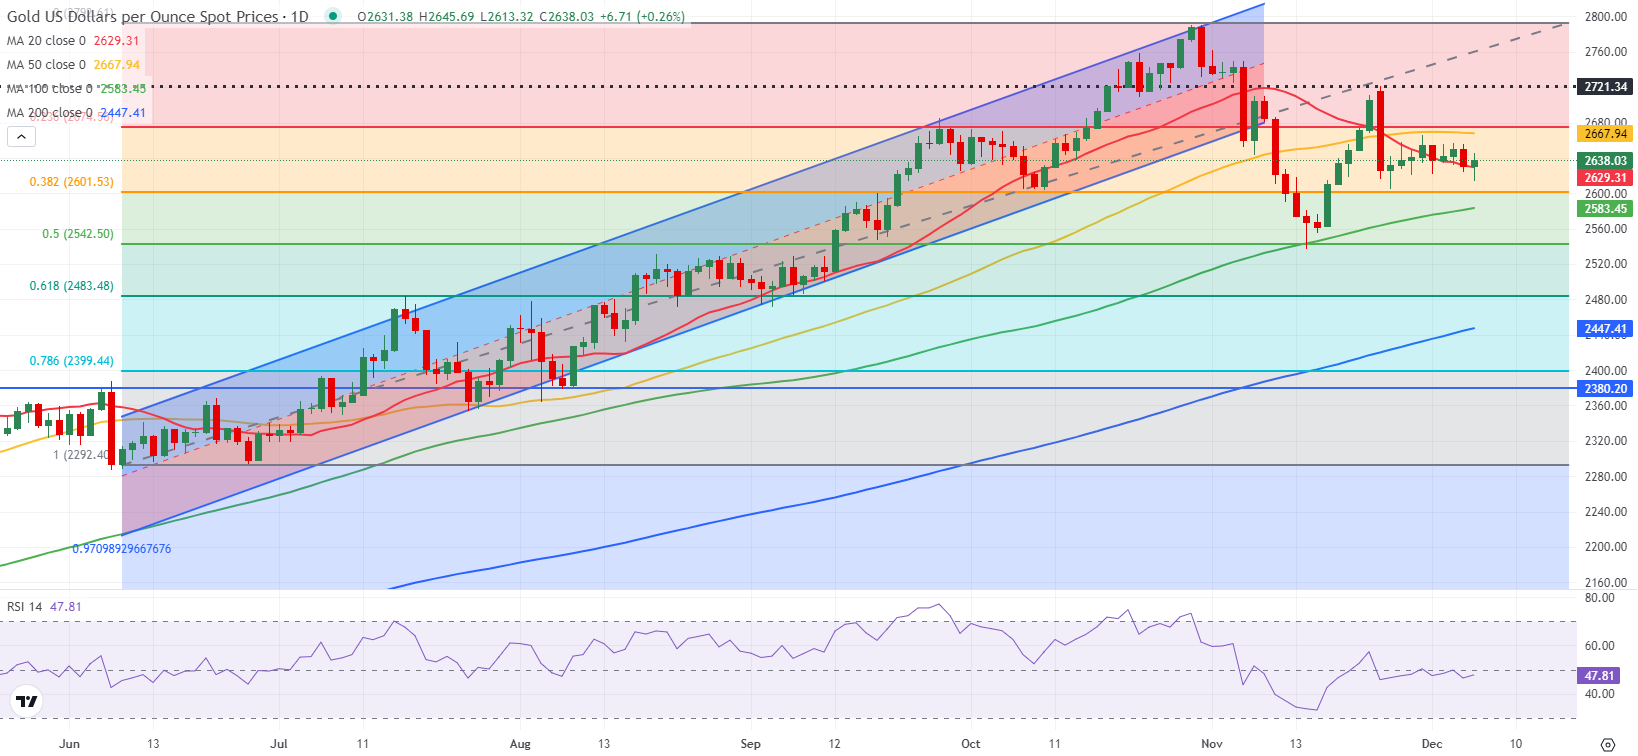
The Relative Strength Index (RSI) indicator on the daily chart moves sideways near 50, reflecting the lack of directional momentum. On the upside, the Fibonacci 23.6% of the uptrend coming from June and the 50-day Simple Moving Average (SMA) form the first resistance area at $2,670.
In case Gold rises above this level and starts using it as support, technical buyers could show interest. In this scenario, $2,700 (static level, round level) could be seen as the next hurdle before $2,720 (static level) and $2,760 (static level).
Looking south, first support could be spotted at $2,600 (Fibonacci 38.2% retracement) ahead of $2,580 (100-day SMA) and $2,540 (Fibonacci 50% retracement).
Gold FAQs
Gold has played a key role in human’s history as it has been widely used as a store of value and medium of exchange. Currently, apart from its shine and usage for jewelry, the precious metal is widely seen as a safe-haven asset, meaning that it is considered a good investment during turbulent times. Gold is also widely seen as a hedge against inflation and against depreciating currencies as it doesn’t rely on any specific issuer or government.
Central banks are the biggest Gold holders. In their aim to support their currencies in turbulent times, central banks tend to diversify their reserves and buy Gold to improve the perceived strength of the economy and the currency. High Gold reserves can be a source of trust for a country’s solvency. Central banks added 1,136 tonnes of Gold worth around $70 billion to their reserves in 2022, according to data from the World Gold Council. This is the highest yearly purchase since records began. Central banks from emerging economies such as China, India and Turkey are quickly increasing their Gold reserves.
Gold has an inverse correlation with the US Dollar and US Treasuries, which are both major reserve and safe-haven assets. When the Dollar depreciates, Gold tends to rise, enabling investors and central banks to diversify their assets in turbulent times. Gold is also inversely correlated with risk assets. A rally in the stock market tends to weaken Gold price, while sell-offs in riskier markets tend to favor the precious metal.
The price can move due to a wide range of factors. Geopolitical instability or fears of a deep recession can quickly make Gold price escalate due to its safe-haven status. As a yield-less asset, Gold tends to rise with lower interest rates, while higher cost of money usually weighs down on the yellow metal. Still, most moves depend on how the US Dollar (USD) behaves as the asset is priced in dollars (XAU/USD). A strong Dollar tends to keep the price of Gold controlled, whereas a weaker Dollar is likely to push Gold prices up.
Premium
You have reached your limit of 3 free articles for this month.
Start your subscription and get access to all our original articles.
Author

Eren Sengezer
FXStreet
As an economist at heart, Eren Sengezer specializes in the assessment of the short-term and long-term impacts of macroeconomic data, central bank policies and political developments on financial assets.


