Is the NASDAQ100 in a long-term bear market?

Using the Elliott Wave Principle (EWP), we have been tracking the most likely path forward for the NASDAQ100 (NDX). Although there are many ways to navigate the markets and to each their own, we find the EWP to be the most reliable and accurate. Namely, we’ve been tracking an ending diagonal (ED) advance of the August 2024 low over the last four months.
EDs are tricky because all their waves comprise three waves: 3-3-3-3-3. Besides, W-iii typically targets the 123.6-138.2% extension of W-i, measured from W-ii. The W-iv then tends to correct back to the 61.8-76.4% extension, after which the last W-v targets, ideally, the 161.8-176.4% extension.
(Red) W-iii topped December 16 at $22133, and (red, alt) W-iv may have bottomed out on January 13 at $20538, while (red, alt) W-v only reached $22222 on February 19. See Figure 1 below. In this case, the W-iii surpassed its ideal Fibonacci-based target zones, whereas the alt: W-iv fell short (green squares) for an ED. Also, the alt: W-v fell short of its target zone (Red square). Thus, although we were correctly looking for higher prices in our previous update, the market did not reach the ideal targets.
Figure 1. NDX daily chart with detailed Elliott Wave count and technical indicators
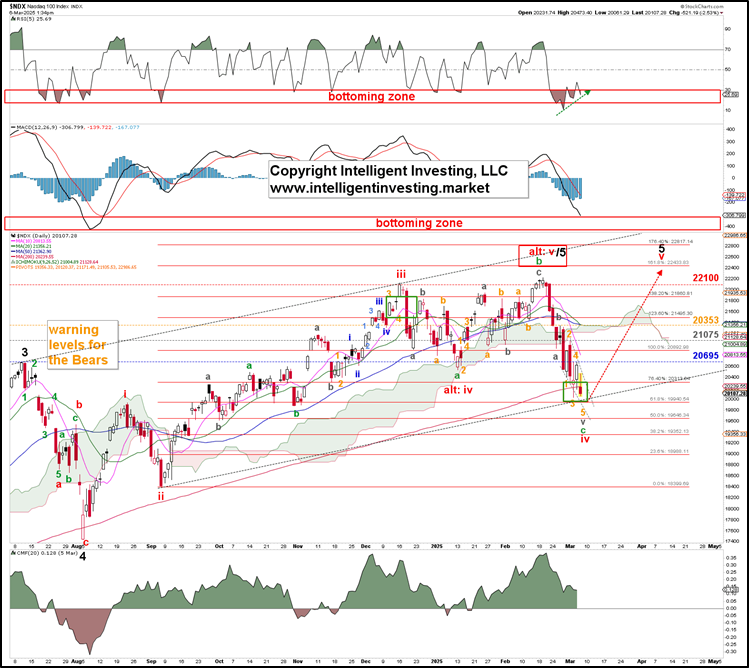
It shows that price is the final arbiter, and the markets do not owe us anything, i.e., they do not have to reach ideal target zones, such a big miss is uncommon and troubling for this potential wave count.
Besides, back in February we were humble enough to recognize that, while
“We prefer to have a Bullish perspective until proven otherwise [, … which is a] break below …. $21008 for starters, but ultimately, the January 13 low at $20538 remains the Bull-Bear line in the sand. If the market decides to move below these levels, our preferred EW count switches to our alternative, which has the more significant red W-iv become protracted and target $19930-20300 before the red W-v starts. But as stated, that’s our alternative, our insurance, in case we are wrong.”
As such, the index is likely completing an irregular expanded flat in EWP terms: W>c>b>a. The ideal target is the 61.80% extension of red W-i, measured from red W-ii, at $19940, which the index is getting close to today, and coincidentally coincides with the black dotted parallel lower trendline. If the index can hold that level, especially the 50% Fib-extension at $19646, we can look forward to ideally the (red) 161.80% Fib-extension at $22434.
Lastly, sentiment has become highly bearish even though the index reached an all-time high just two weeks ago and has, so far, only lost 10% top-to-bottom. See Figure 2 below. This week’s AAII’s bearish sentiment remains unusually and historically high, which over its entire 38-year history, only happened during significant bear markets (1990, 2008, 2022). Moreover, CNN’s Fear and Greed Index has been below 25, which is extreme fear territory, for over a week now. Meanwhile, seasonality for a post-election year in which the incumbent president lost is turning bullish.
Figure 2. Sentiment and seasonality
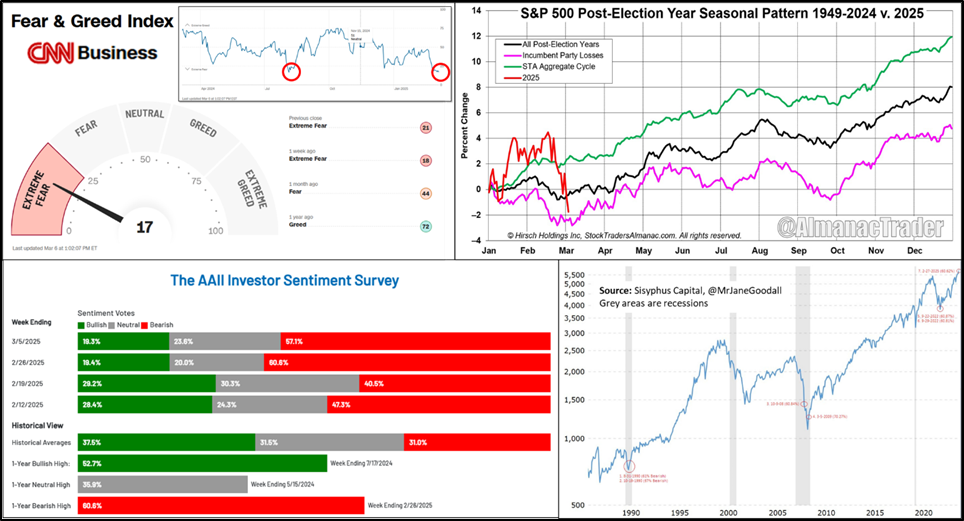
Although these conditions are not trade triggers, and seasonality is only an average, it aligns with our “irregular expanded flat” W-iv EWP count. Thus, our Elliott Wave analysis provides specific levels to watch. How the market reacts to those combined with the structure of that reaction will tell us how to adjust if needed: all we can do is anticipate, monitor, and adjust if necessary. Although previously, our preferred EW count was correctly looking for higher prices, the upside target was not reached, but as we stated last, “we’re simply monitoring its progress to see if it aligns with the market’s price action. If yes, stay long and keep monitoring. If not, adjust and take appropriate trading action.”
Over the last weeks, we monitored the index, found it started to diverge from our preferred EWP count, and adjusted accordingly. As such, we must also lower the ideal upside target from $22836-$23400 to $22451, contingent on holding above key price levels. Thus, the Bulls have a last chance to reach that level. However, once reached, an even more significant correction can start, if not an outright multi-year Bear market.
Author

Dr. Arnout Ter Schure
Intelligent Investing, LLC
After having worked for over ten years within the field of energy and the environment, Dr.


