Gold, The Chart of the Week: XAUUSD bears licking their lips, watching for lower timeframe distribution
- Gold could be about to move into a phase of distribution.
- The rally is decelerating on the lower timeframes.

As per last week's pre-open analysis, Gold, Chart of the Week: XAUUSD bulls pushing up against key resistances ahead of US CPI, where it was explained that there were prospects of a bull correction to fully test the bear's commitments with a focus on the US Consumer Price Index data for the forthcoming week, Gold indeed moved higher as the following will illustrate:
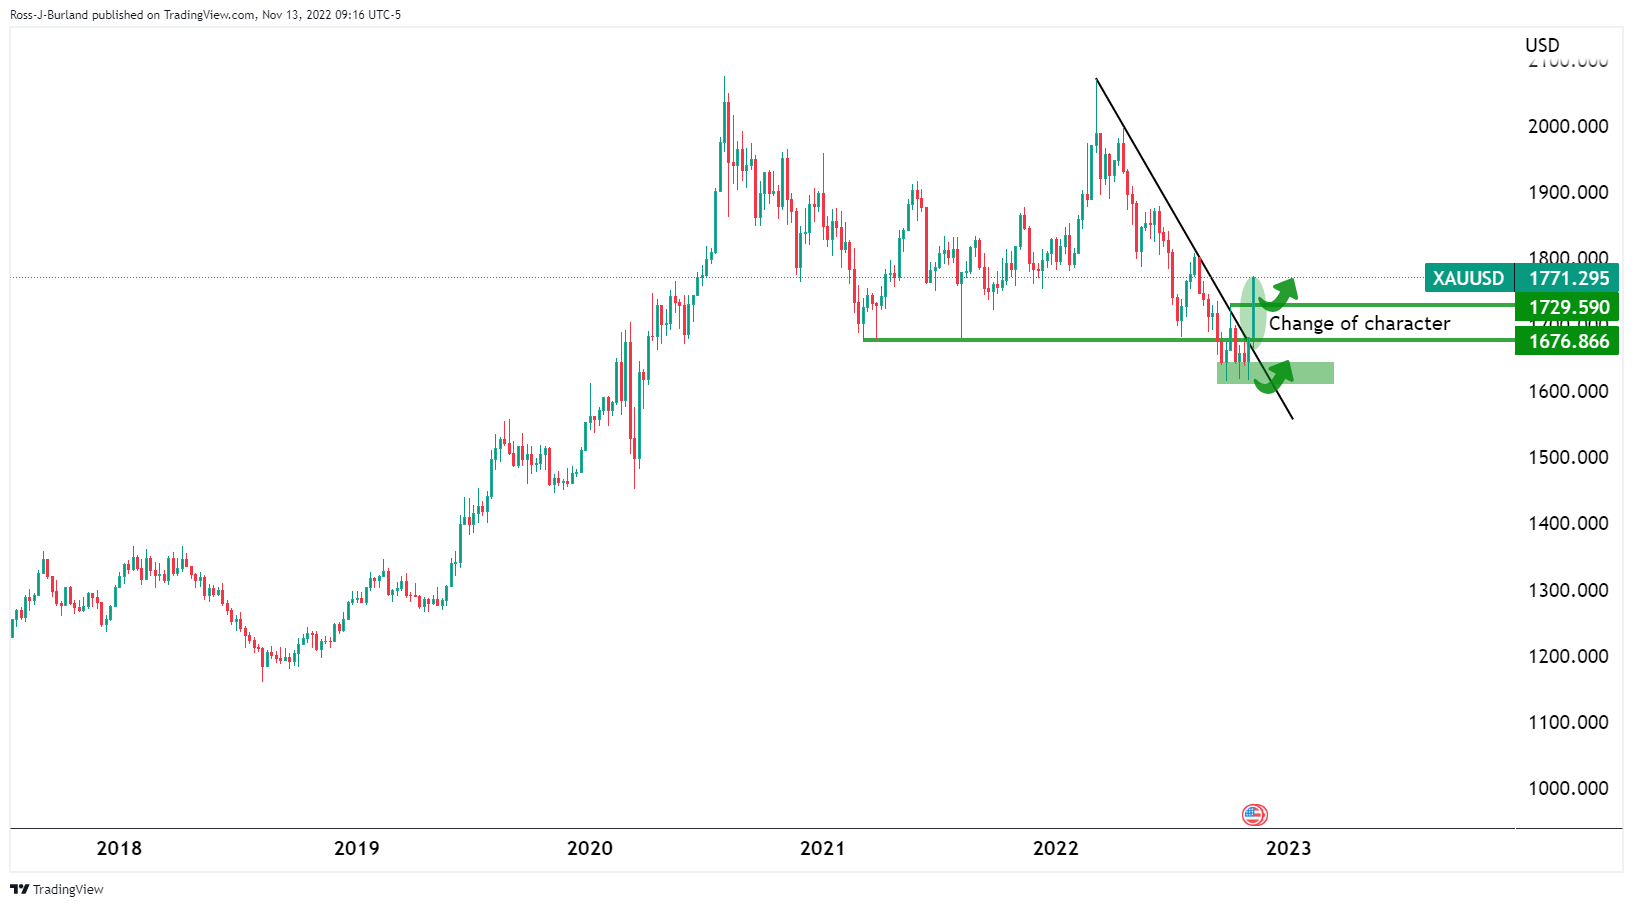
Prior analysis, Gold weekly charts
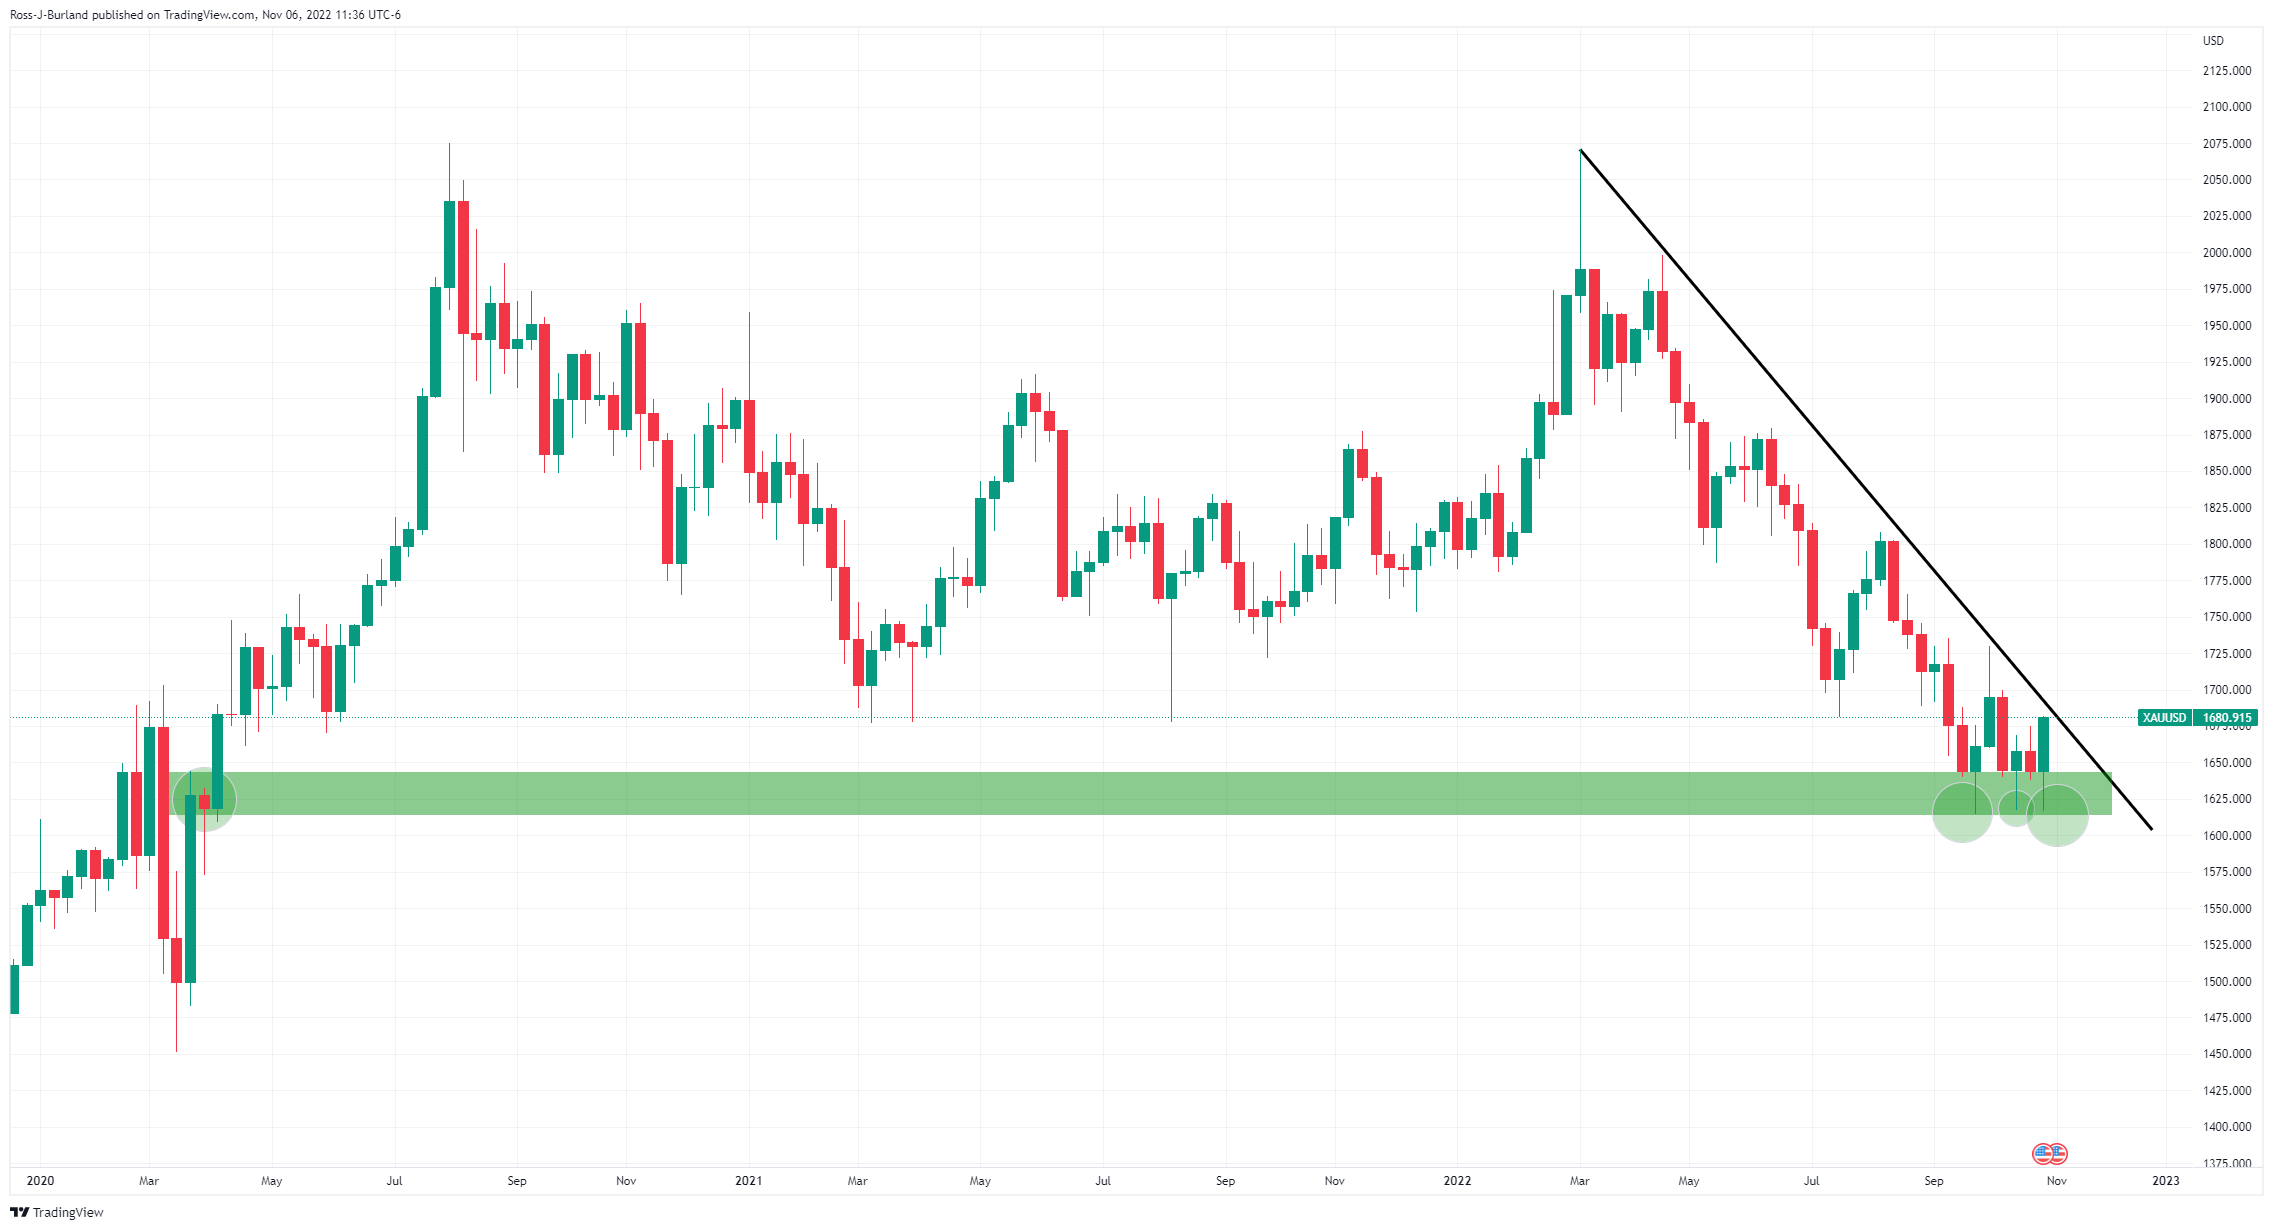
The price was accumulating at a prior structure in three weekly bottoms.
That W-formation looked menacing for the week ahead with prospects of a push into the trendline.
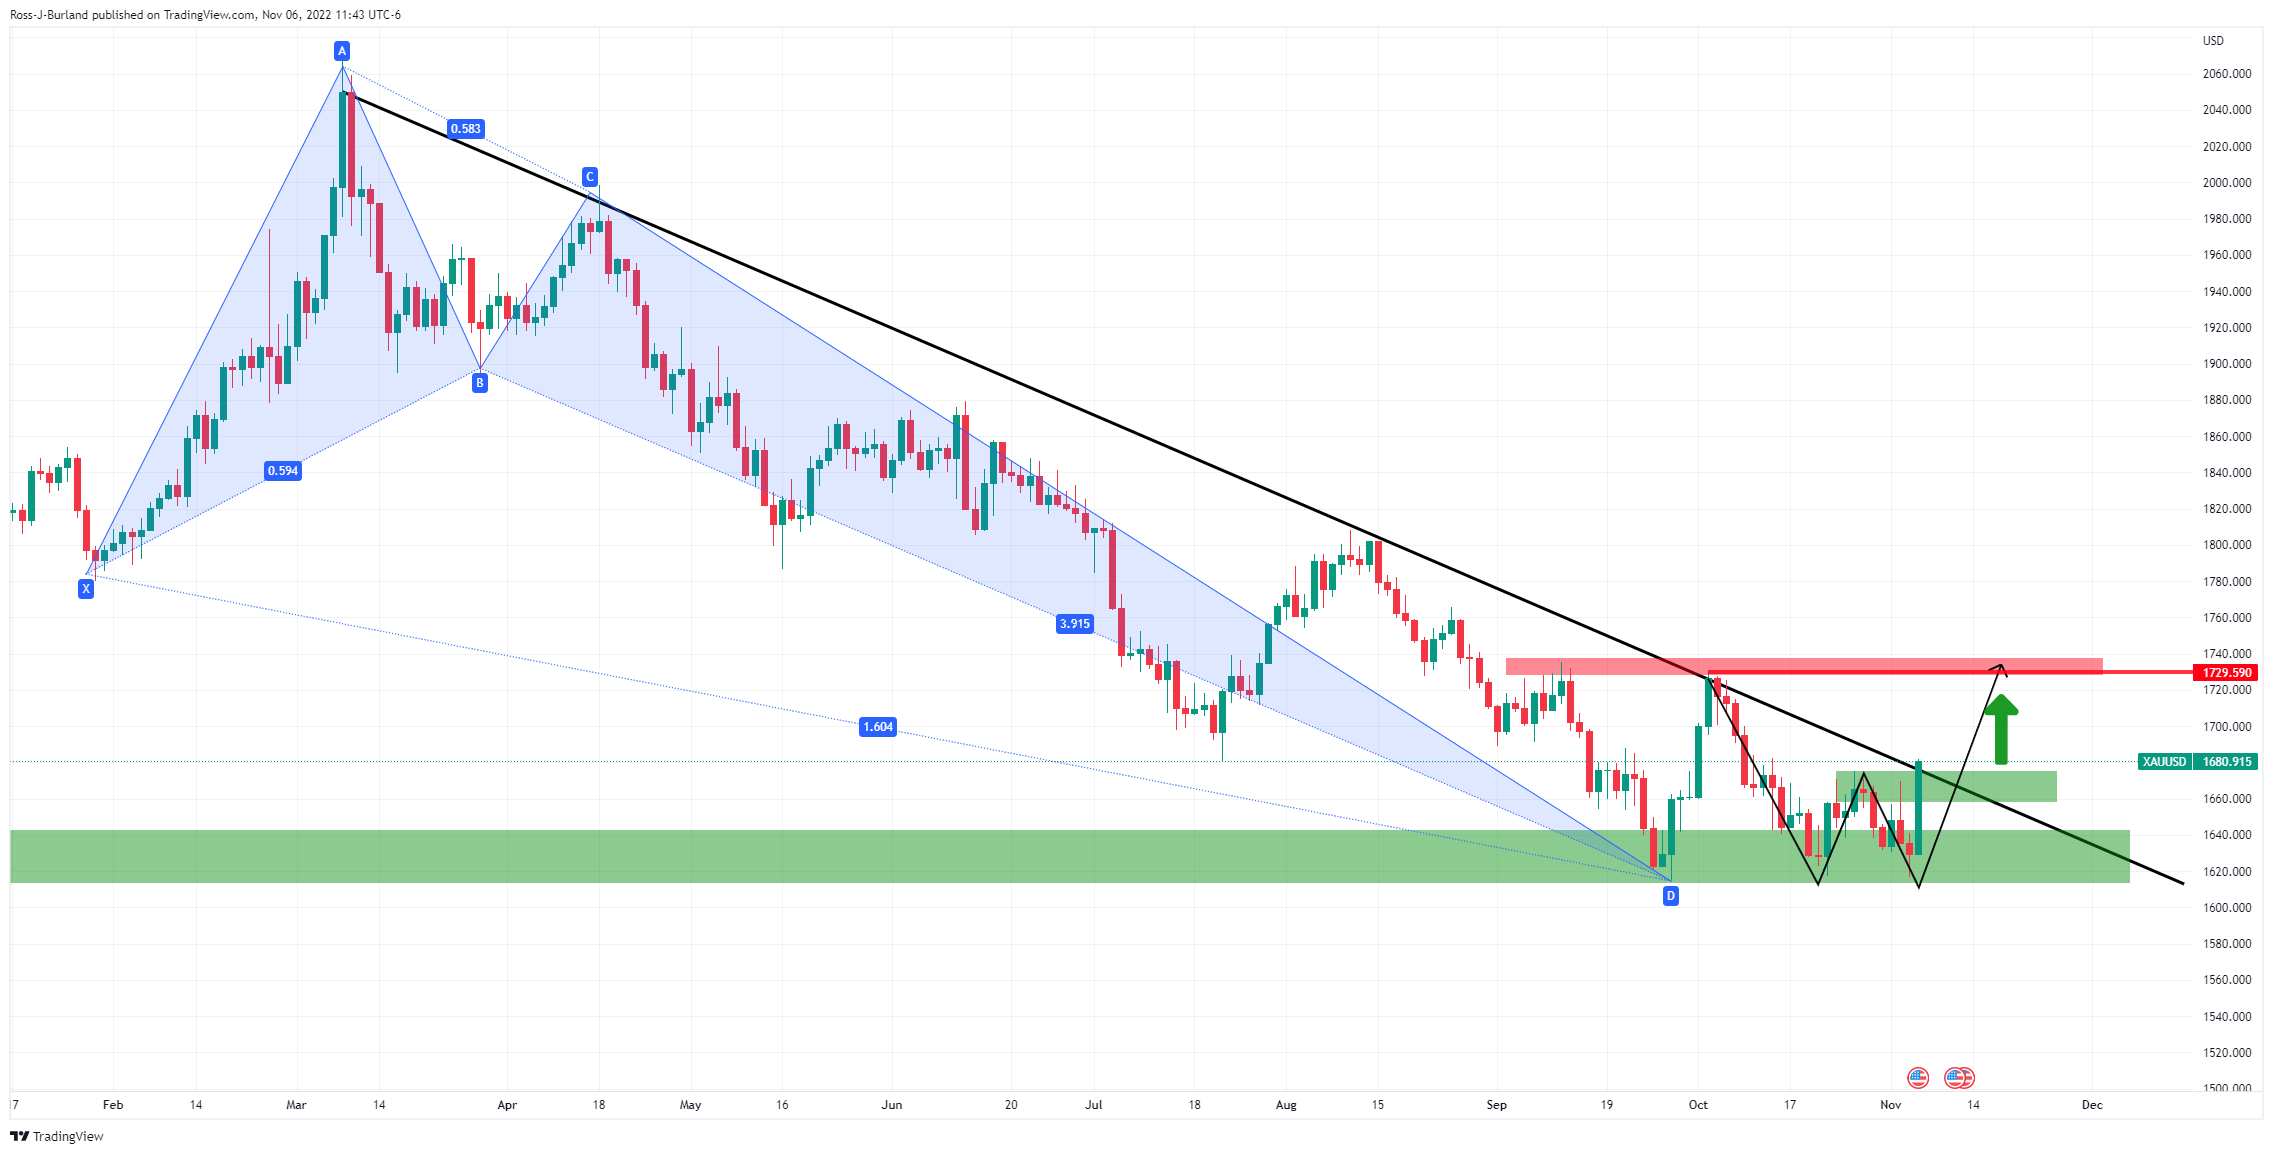
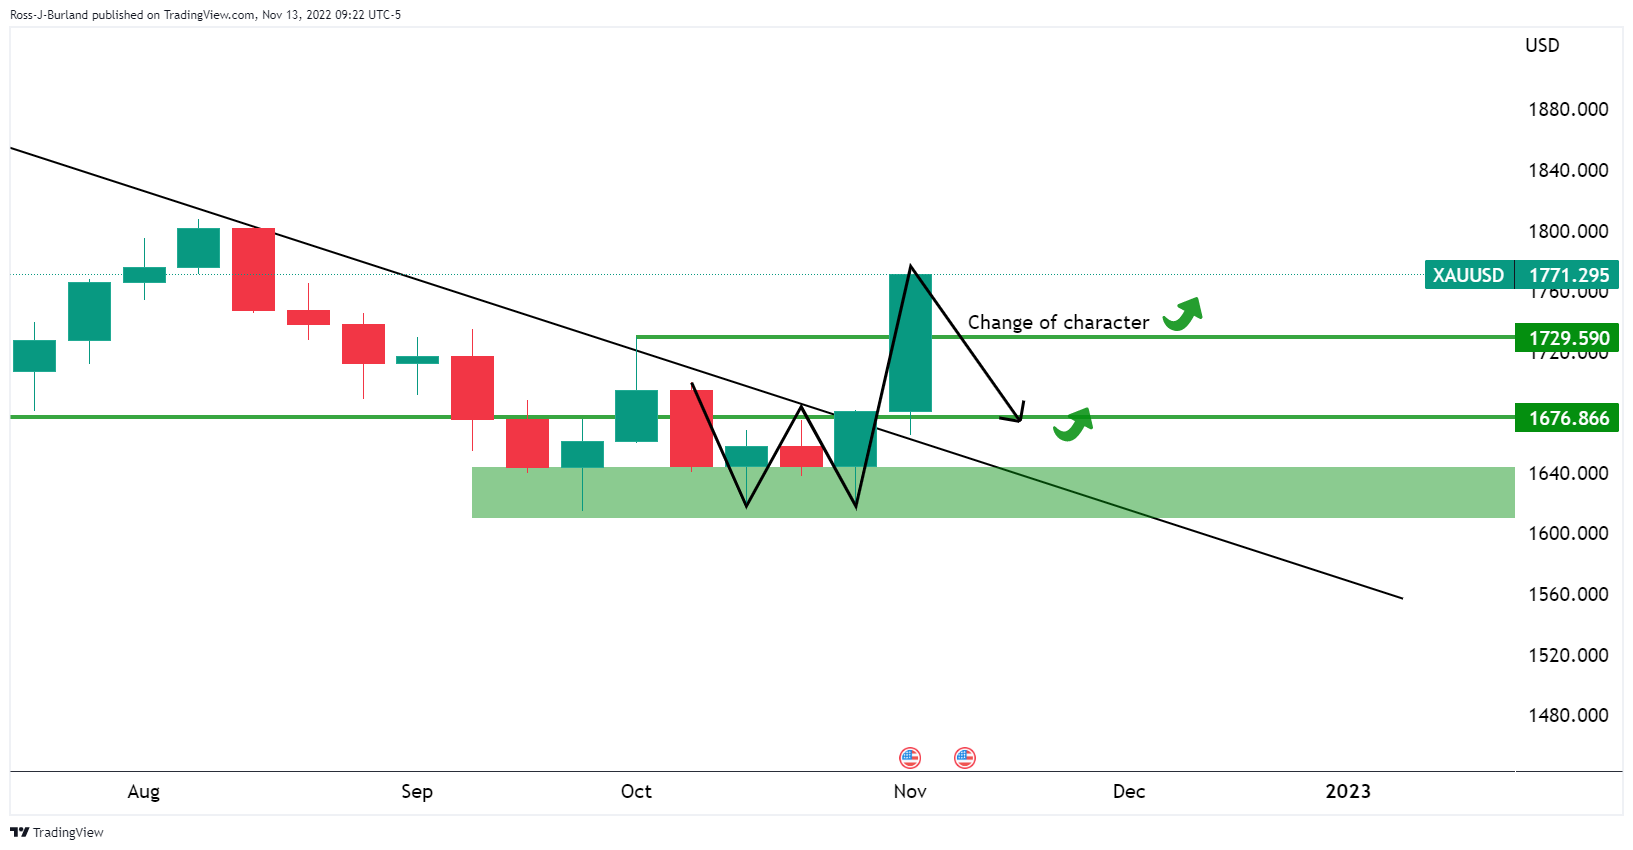
The Crab harmonic pattern on the daily chart was also a bullish feature:
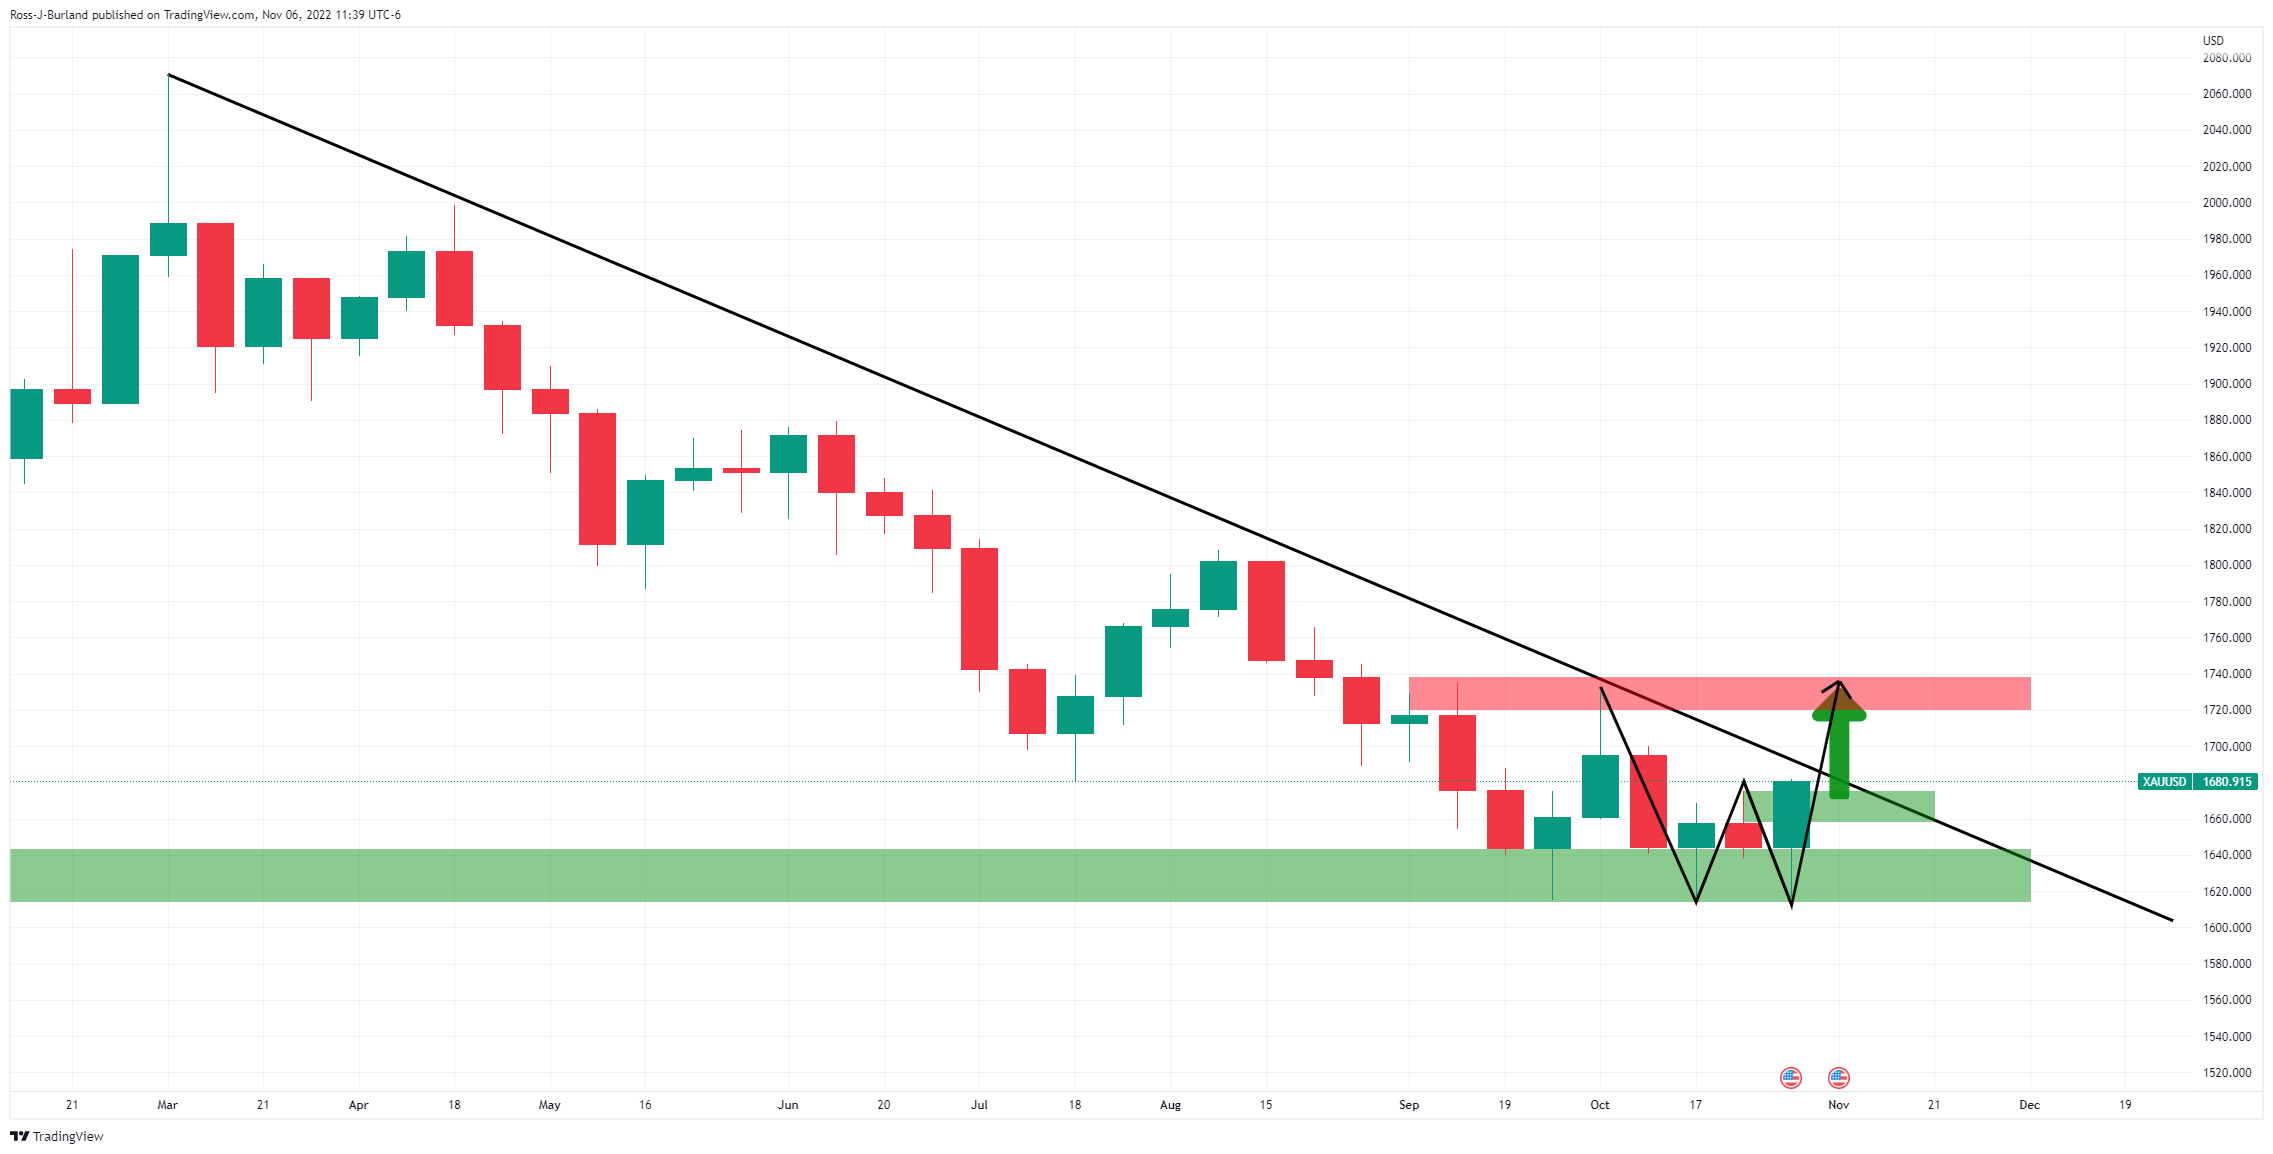
The price had already slid out of a micro trendline and was accumulating on the backside which opened risks of a move higher.
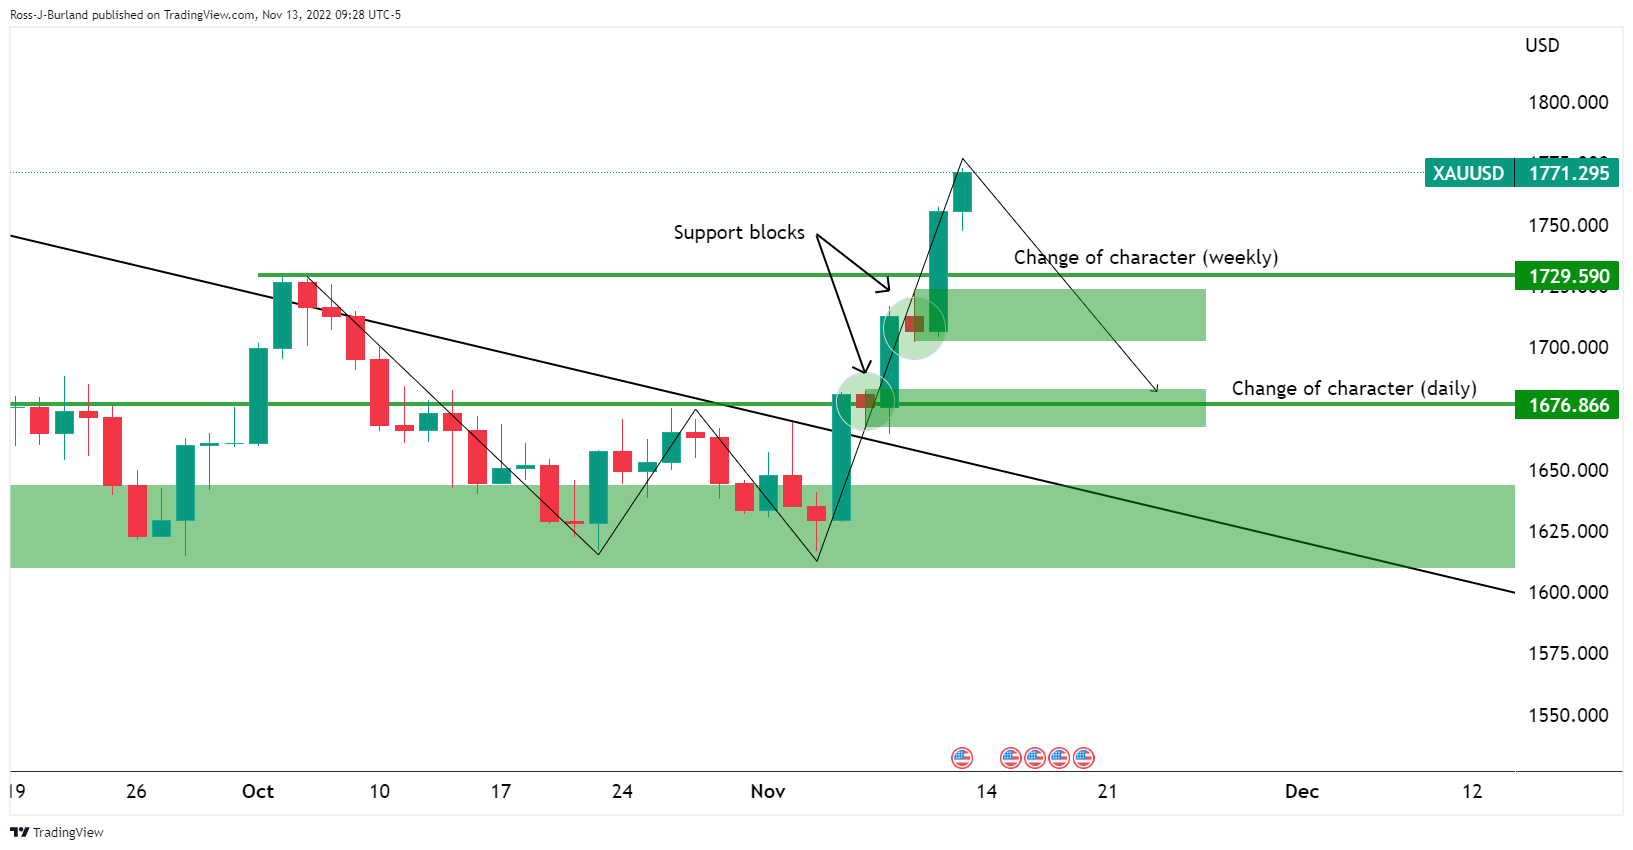
Gold update, weekly chart
While it is still early days, this could be the makings of a prolonged bullish phase given that the price has broken the weekly trendline following a triple bottom and the impulse has closed firmly above the $1,730 structure.
The price action has left a W-formation as follows:
This is a reversion pattern that would be expected to see the price correct back toward the neckline in due course. Having said that, the price has formed a number of lower time frame structures along the way that could serve as support:
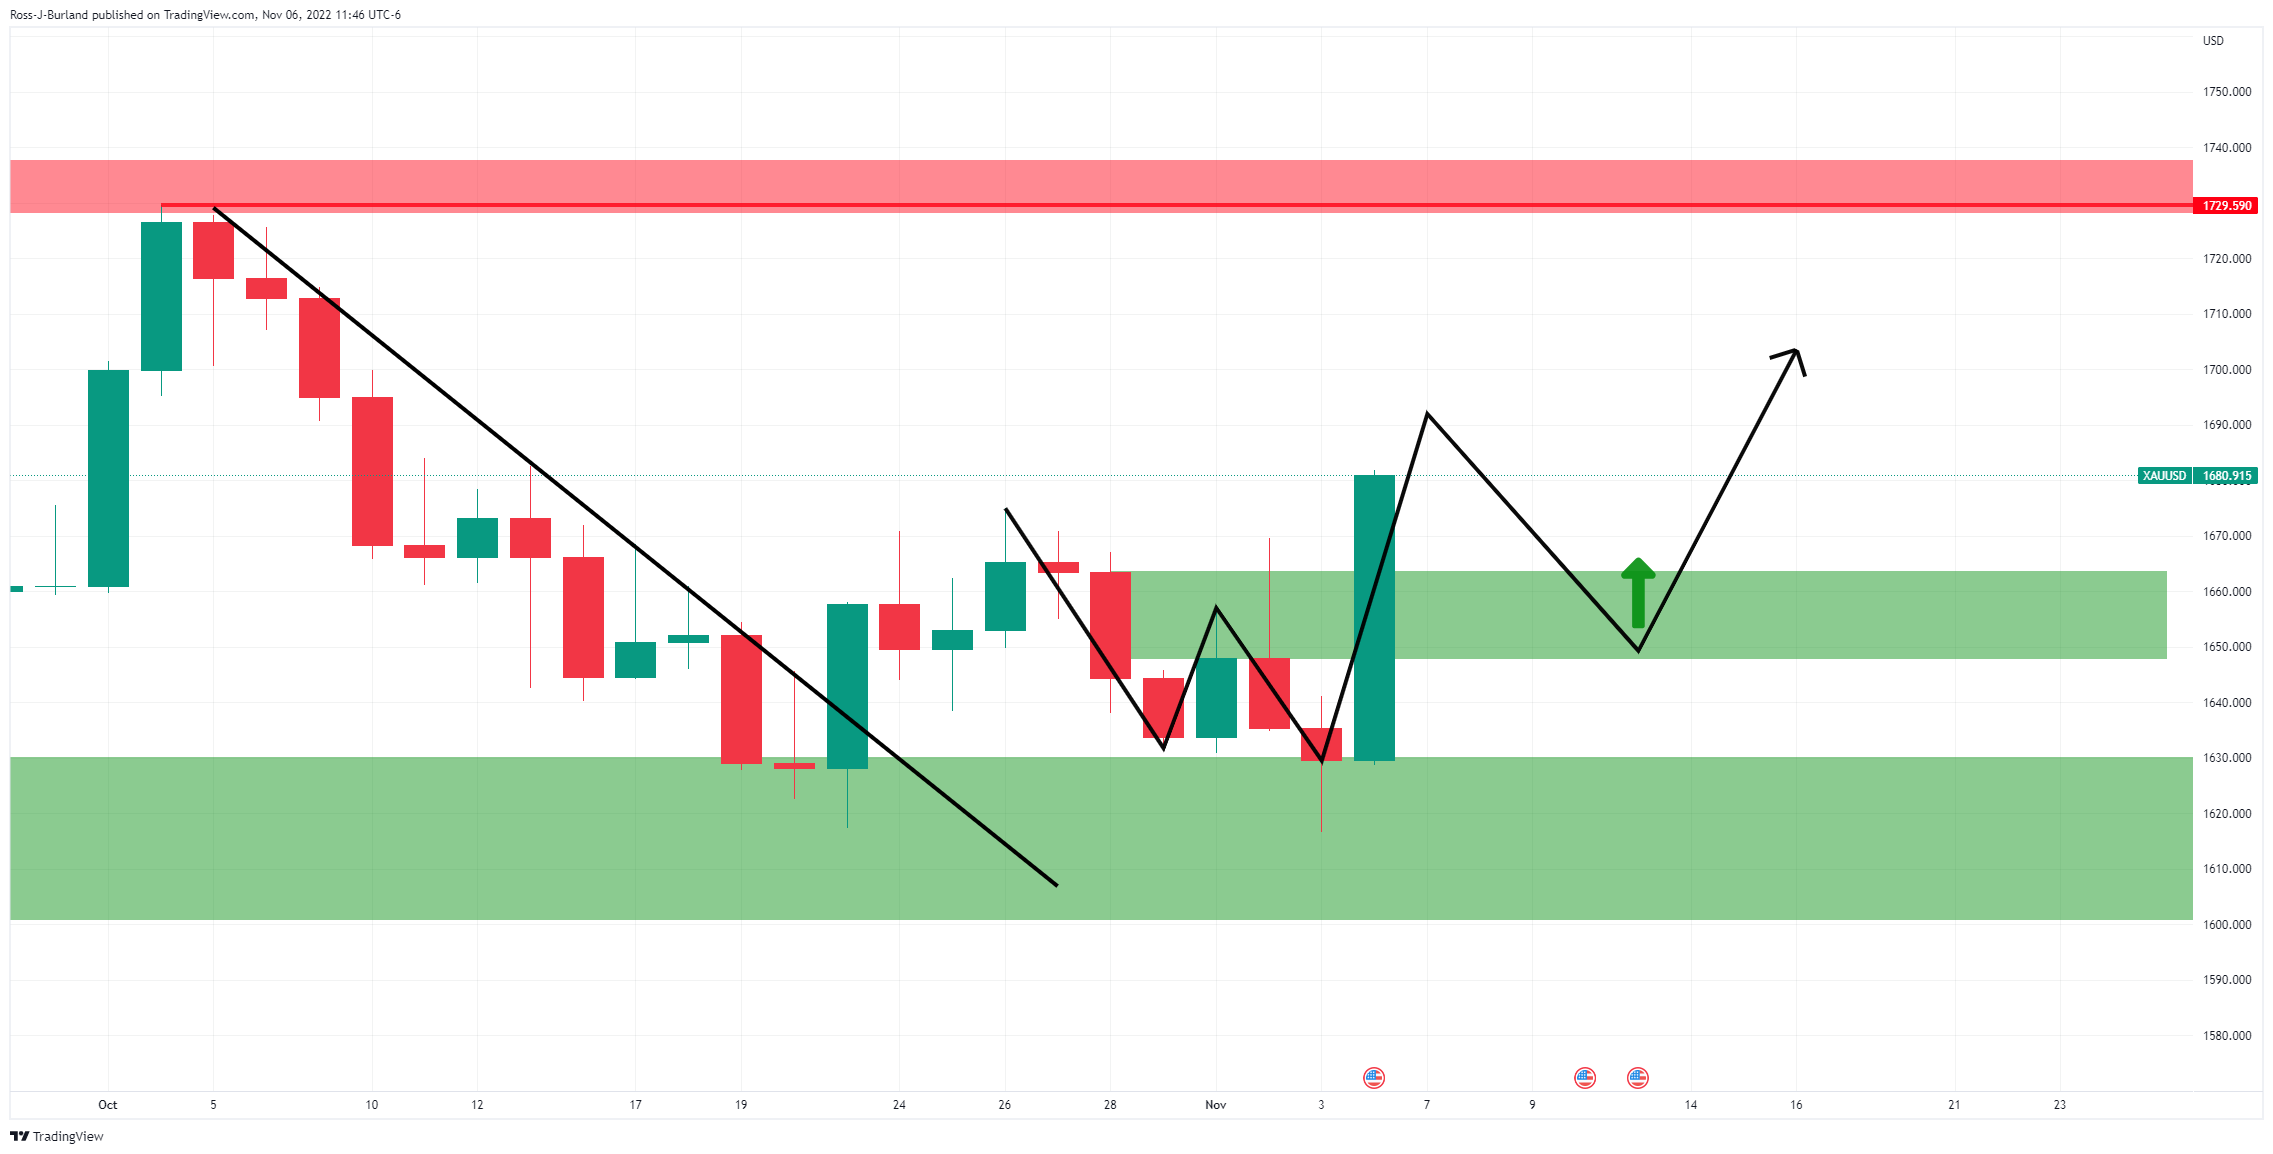
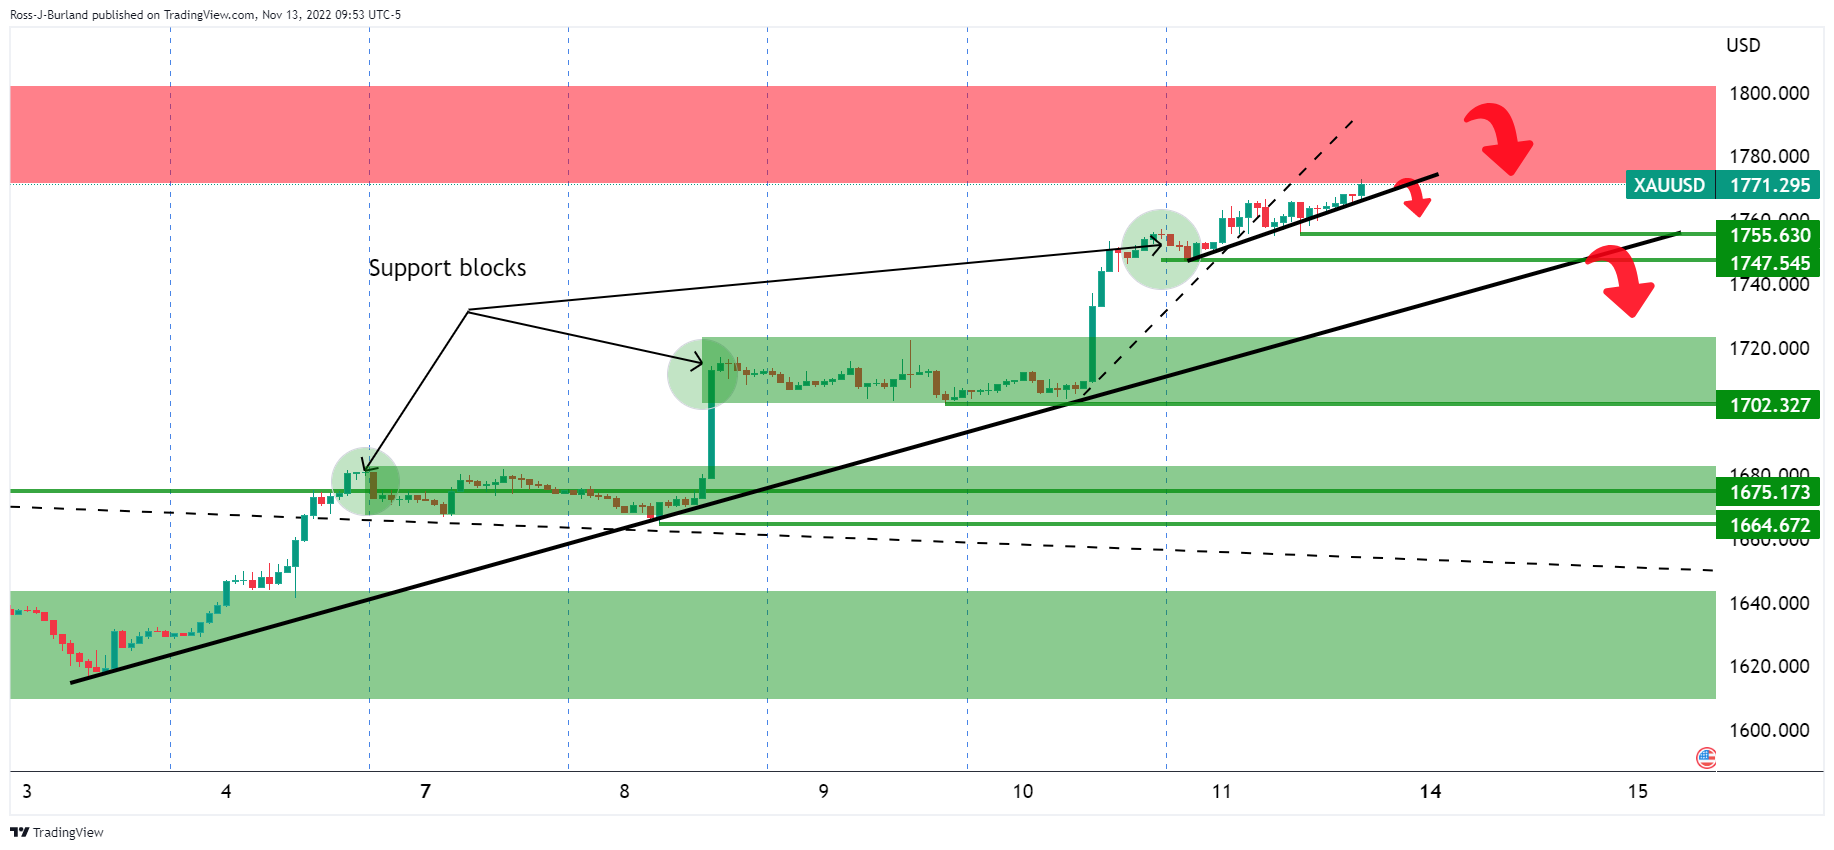
Gold H4 chart
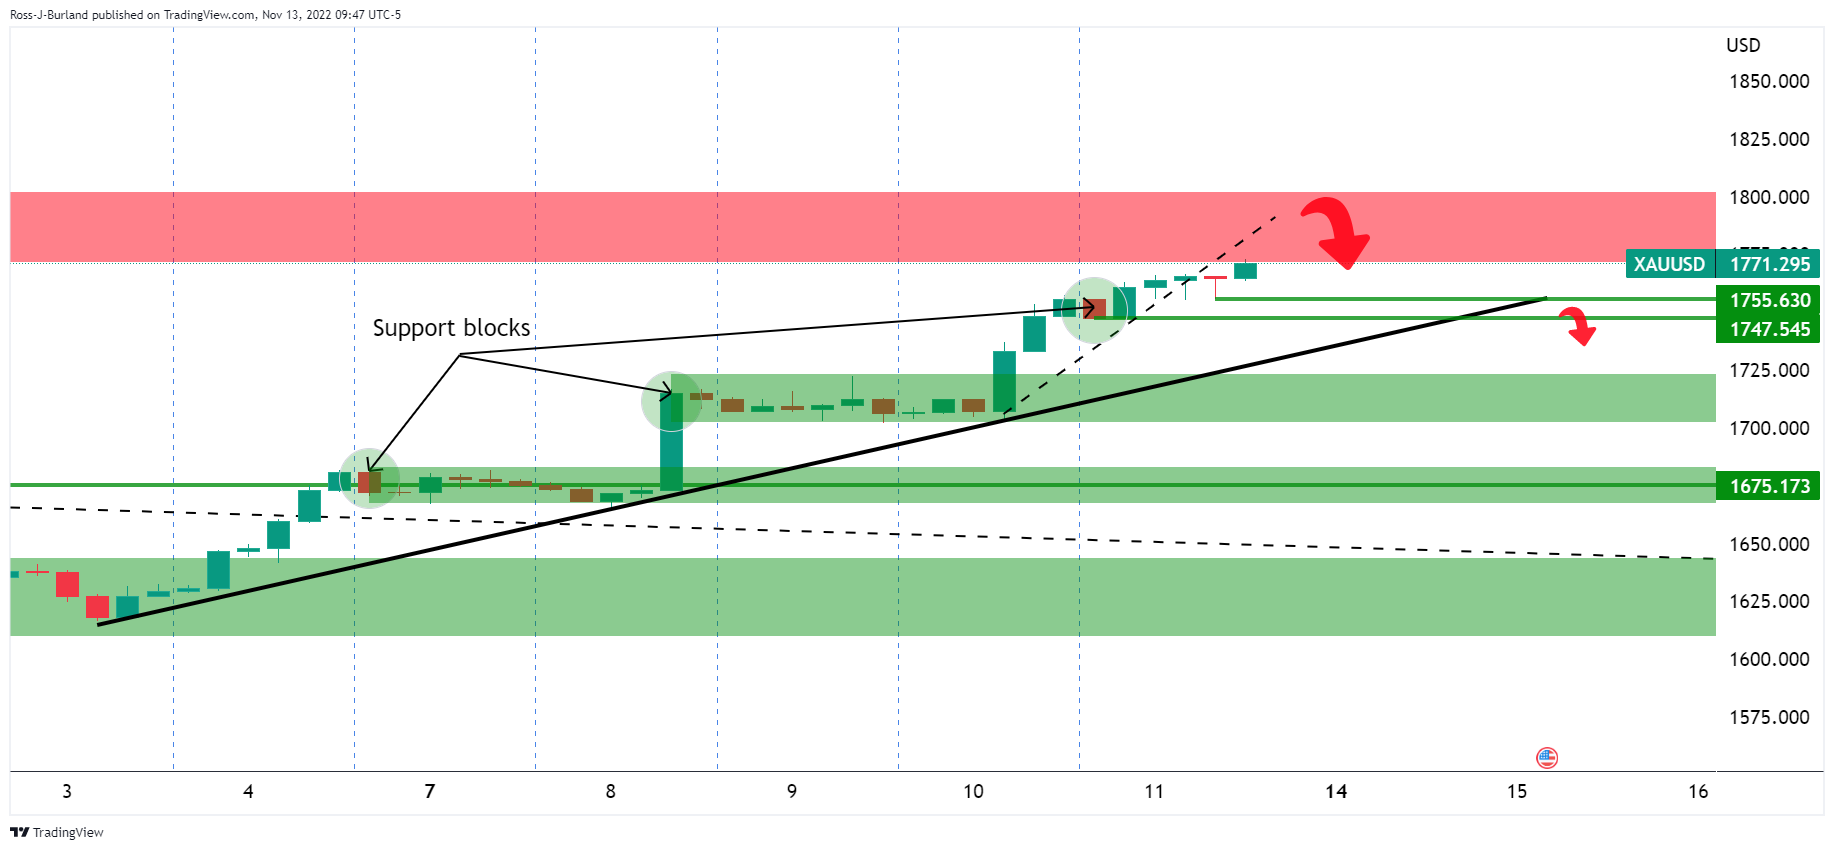
The above chart illustrates the resistance area that the price has been heading towards coupled with the micro trendline that was broken on Friday as a sign of deceleration in the trend. We could expect to see a phase of distribution over the coming days. The hourly chart will be worth keeping an eye on in this regard:
US Dollar meets support
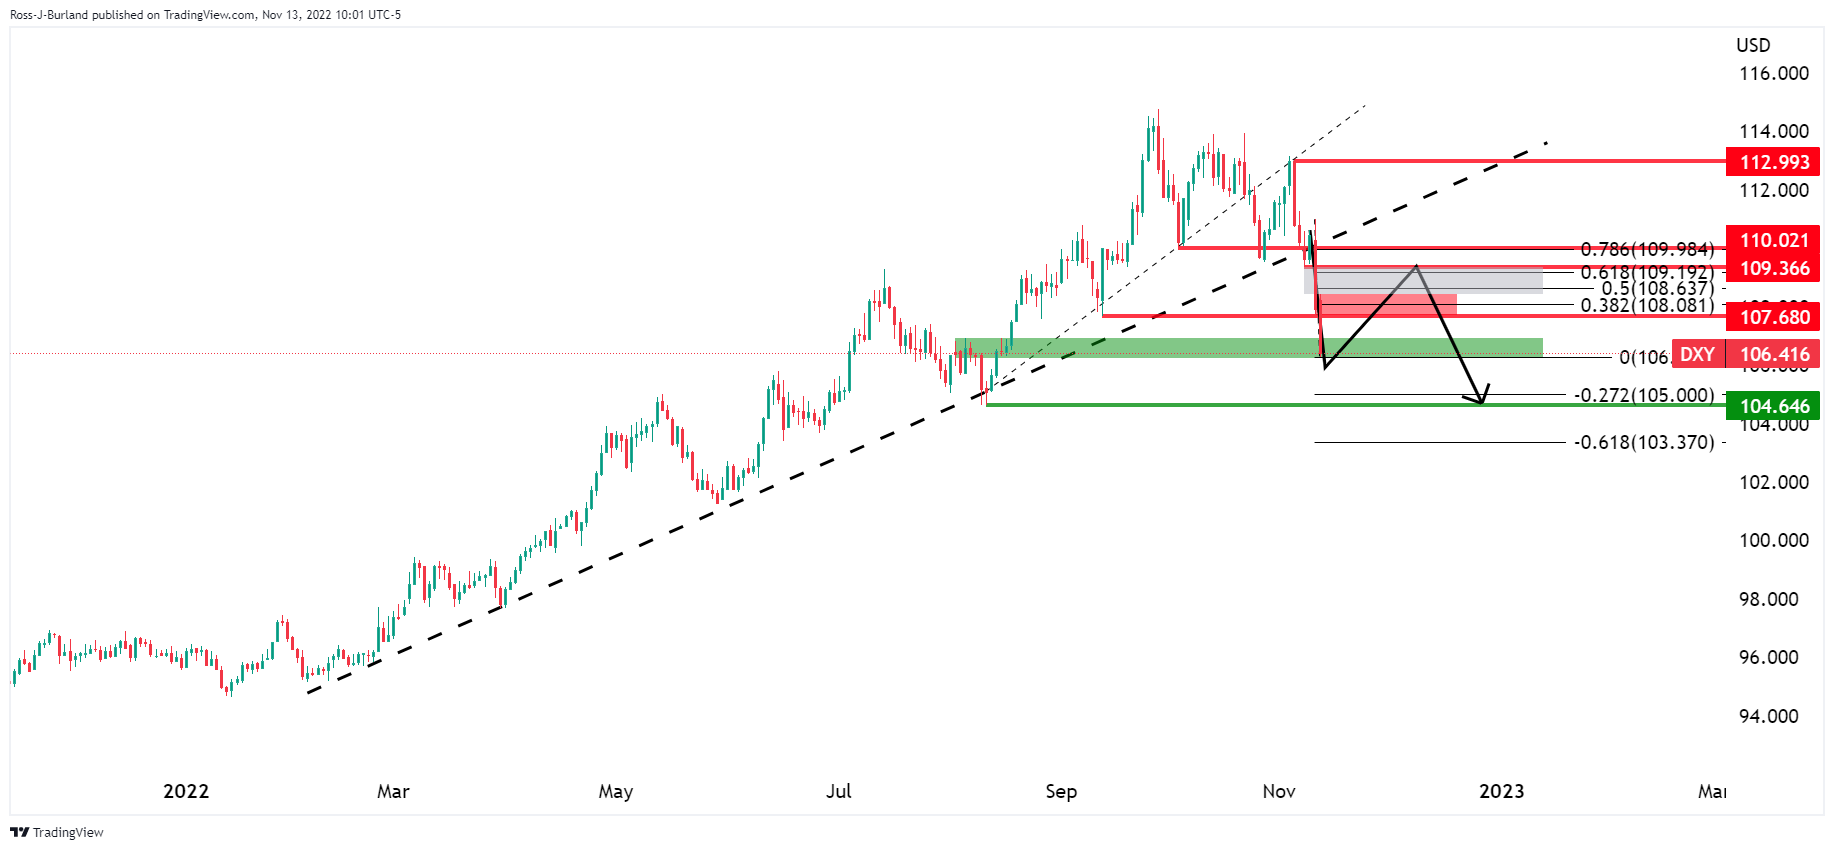
The DXY dropped below a key level of support on Friday, extending the downside below the trendline. However, it would appear that the bears are now meeting support at the lower quarter of the 106 area which could serve as a foundation for a significant correction. A break of 108.00 opens the risk of a prolonged reversion up the Fibonacci scale towards 109.50.
Premium
You have reached your limit of 3 free articles for this month.
Start your subscription and get access to all our original articles.
Author

Ross J Burland
FXStreet
Ross J Burland, born in England, UK, is a sportsman at heart. He played Rugby and Judo for his county, Kent and the South East of England Rugby team.


