Gold Suffered Biggest Weekly Drop in 3 Years on Trade Prospect

Gold hit a three-month low last Friday as the metal loses its luster with increasing prospect of US-China phase 1 trade deal. Spot Gold was down 3.7% last week, its biggest weekly drop since November 2016. A risk on market caused dollar to surge and US equities to break to all-time high. Earlier last week, there was news that China and US have agreed to roll back existing tariffs as part of the phase 1 deal. It buoyed the stock market earlier last week. However, President Trump's denial on Friday introduced further uncertainty in the fate of the trade deal. Reuters reported that the agreement to roll back existing tariffs face fierce internal opposition at the White House.
Gold this year has risen 14% and one of the reasons is because of the US-China trade war. Investors consider Gold as safe haven during economic and political uncertainties. Quantiative Easing and low (in some cases negative) interest rate also bolster the appeal for Gold. Market is currently pricing in the best outcome from the trade deal between U.S and China. However, is the Phase 1 deal really a big breakthrough to be optimistic about? Unfortunately, the core issues between the US and China still remain unsolved. China refused to discuss domestic subsidies and intellectual properties, a key concern of the U.S. On the other hand, U.S. refused to talk about Huawei and other Chinese firms on the entity list. This is the key issue for China. Phase 1 deal therefore accomplishes nothing of significance. A lot of uncertainties still exist and there are doubts whether both sides can achieve significant progress.
Phase 1 trade deal only stipulates China's agreement to buy certain amount of U.S agricultural products. It also secures China's commitment not to manipulate their currency. In return, the U.S agreed not to cancel further tariff to Chinese goods last month. Even in the current form, there's still back-and-forth negotiation as the Chinese wants to have existing tariff's rollback. Should there be a problem along the way, Gold may regain its appeal as safe haven asset.
Gold Elliott Wave Structure
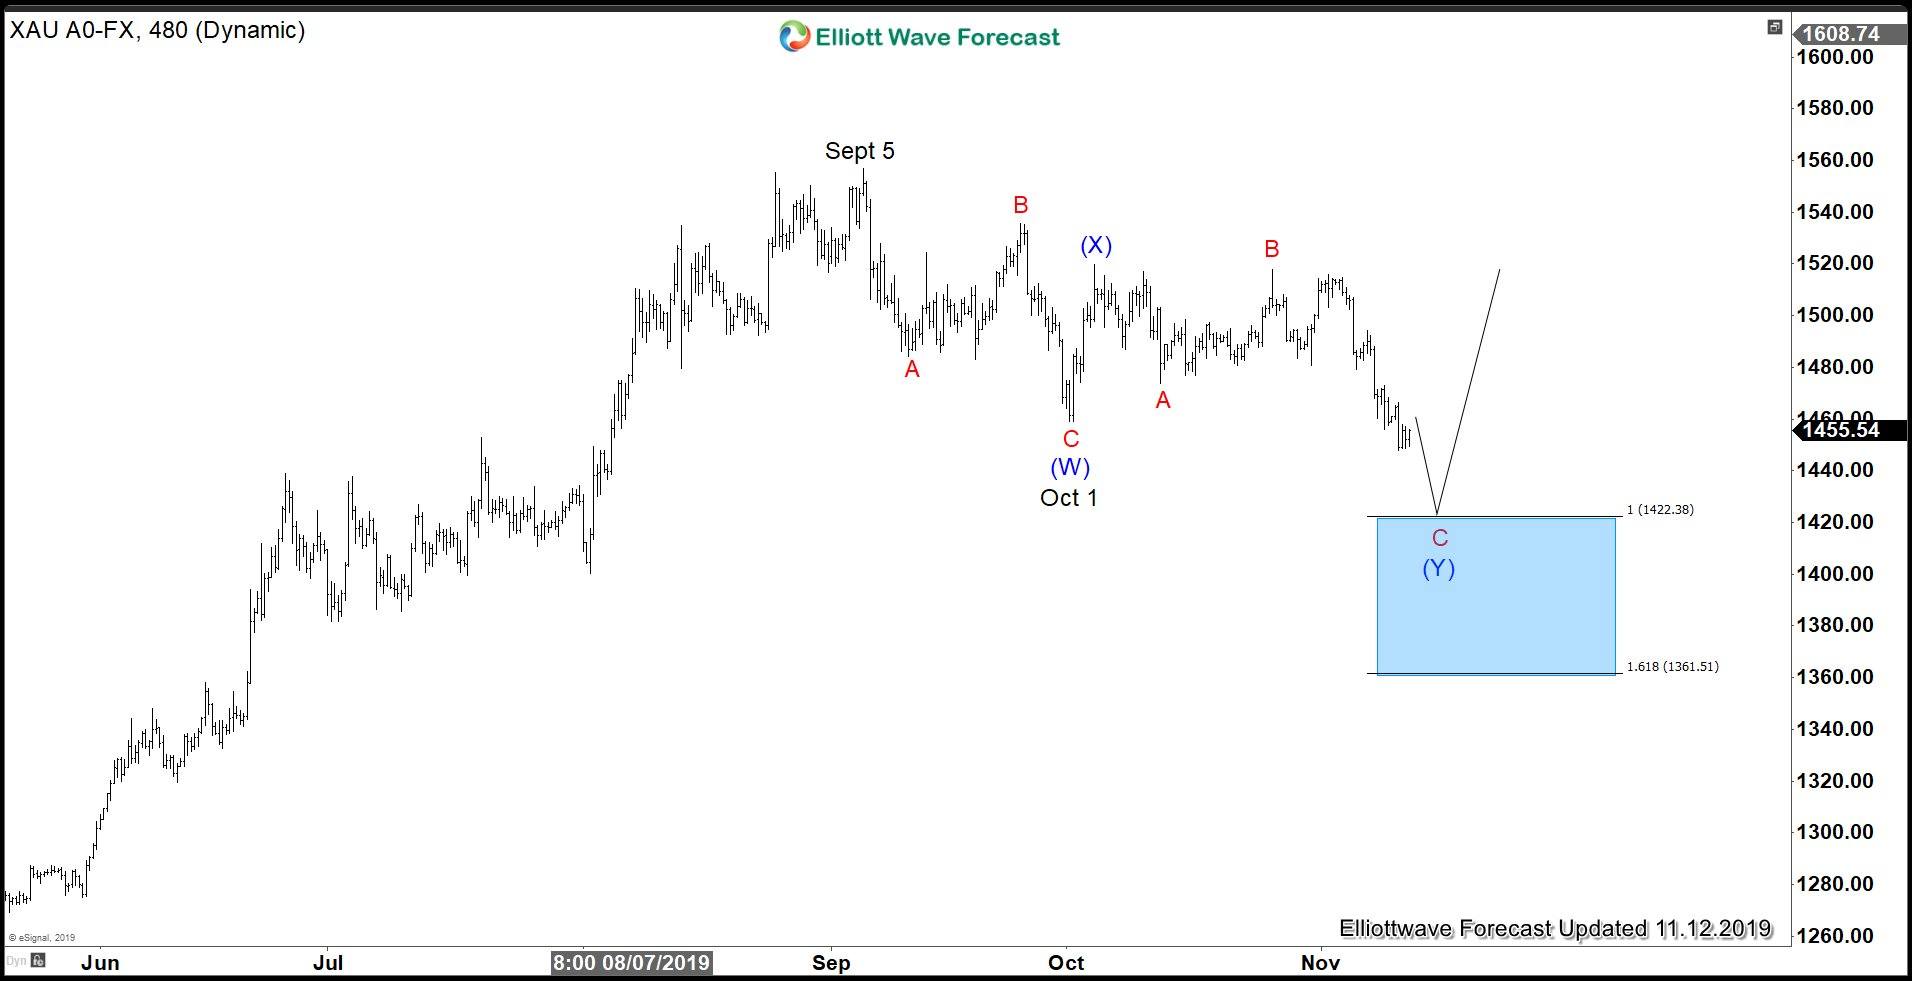
Gold 4 hour chart above shows the decline from Sept 5 is unfolding as a double zigzag Elliott Wave structure. The first leg of the decline from September 5 high to October 1 low was in 3 waves, suggesting the decline is corrective. A 100% extension from September 5 high can see Gold reaching $1361 – $1422 where buyers should appear for more upside or 3 waves bounce at least.
Gold Daily Chart
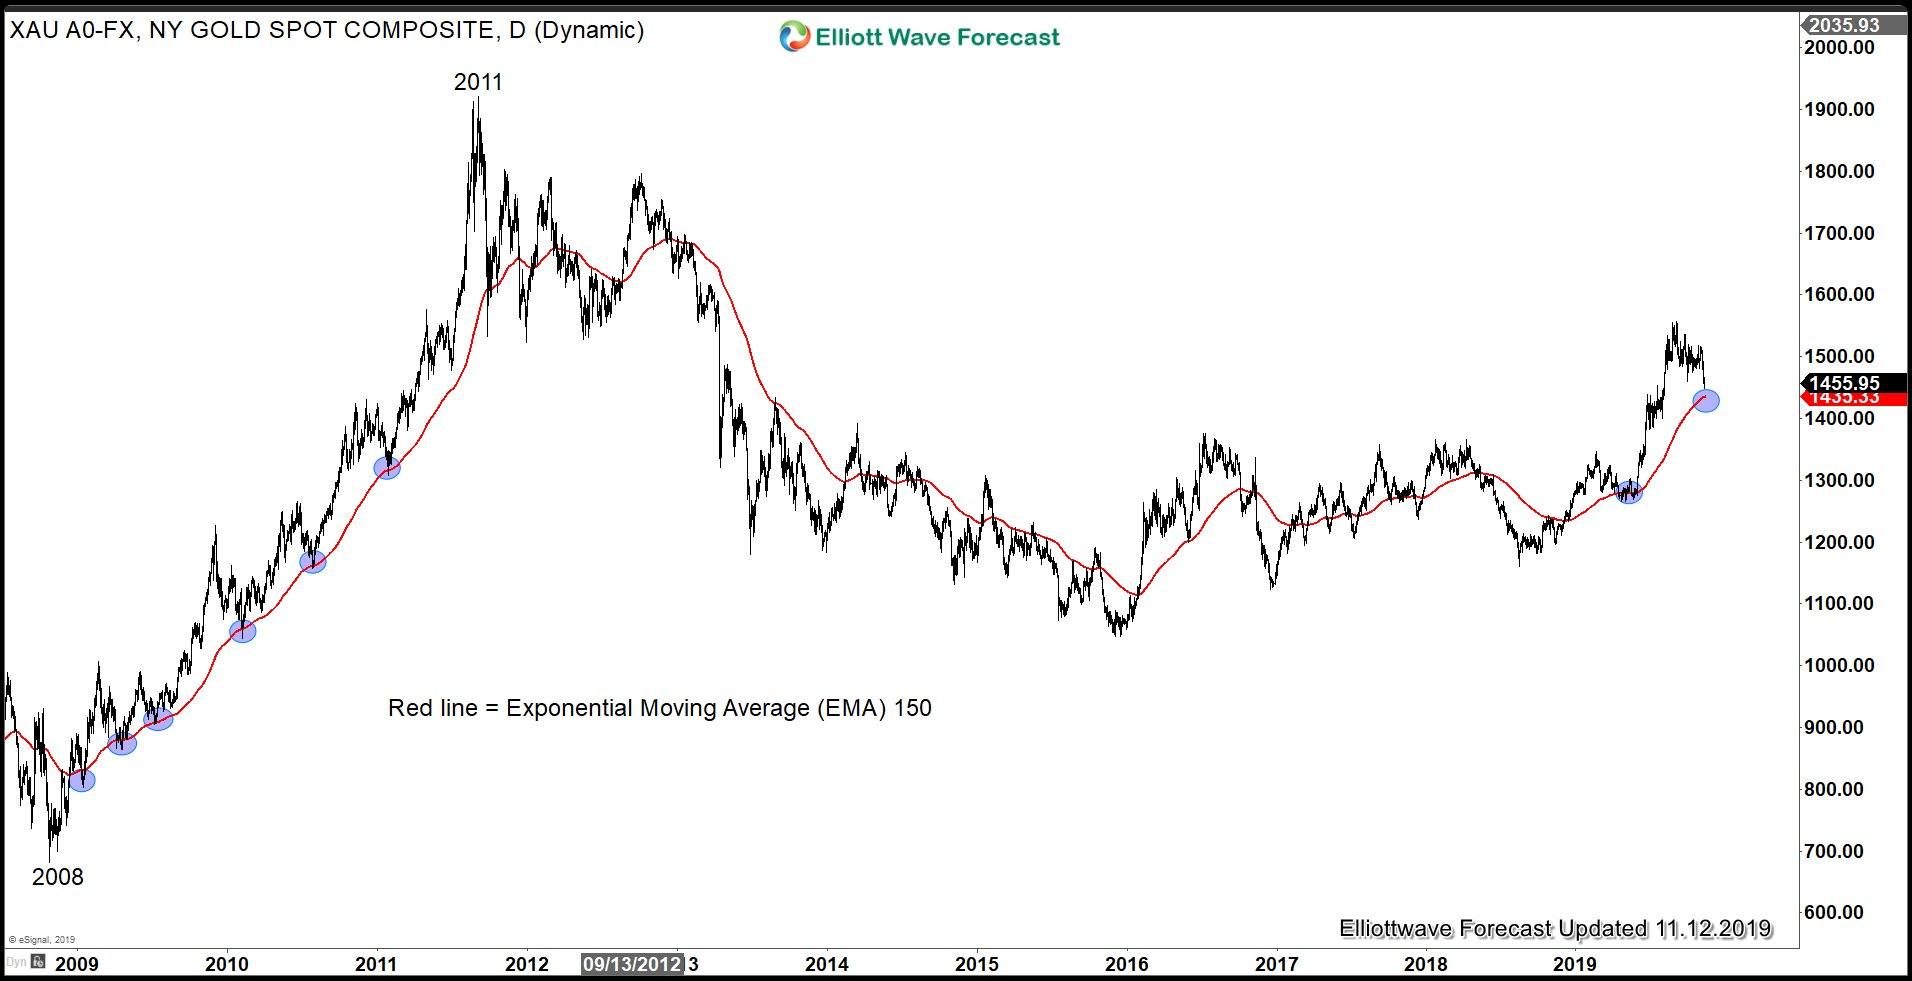
Above is Gold's chart and the red line is Exponential Moving Average (EMA) 150. We can see that during the bull phase from 2008 to 2011, although the rally is strong, it is not a 1 way street. The rally has pullback along the way and each pullback found support at EMA 150, as indicated with blue circle. We can at the current stage, Gold is retesting the EMA 150 again around 1435. The 100% extension area from September 5 comes at around $1420. Thus, it's worth to watch the area around $1420 – $1430 for potential support.
Author

Elliott Wave Forecast Team
ElliottWave-Forecast.com


