Gold: Skis are on, time to choose the slope

Depending on the upcoming FOMC meeting, gold will need to choose one of the two ways down – the ski trail or the black slope. Which one lies ahead?
In the skiers’ vernacular, a ski trail is a very easy way down, with a light gradient at full length. It looks like the late-2012 decline in gold. However, there is also a black slope – a steep and dangerous road on which inexperienced skiers can hurt themselves badly; it’s very similar to what happened to gold in 2008 and 2020. While we don’t know yet which way we will choose to go down (as we have probably just reached the top), the nearest FOMC event will most likely shove us towards one of them. Let’s put our helmets on.
The world is holding its breath for today’s comments from the Fed, knowing that one of the approaches would be a game-changer.
If the Fed hints that it’s ready to taper its stimulus, the long-term rates will likely rally, whereas stocks, precious metals, and commodities will likely slide. But if they don’t do that, it seems that whatever has been going on in the above markets will likely continue based on their technical developments.
In the case of gold, it means either a measured late-2012-style decline or a more powerful slide similar to the moves we saw in 2008 and 2020. Which one will it be? Either way, the next big move is likely to be to the downside (even if dovish comments were to spur some immediate-term gains). Why? Because history tends to rhyme, and right now, gold is simply repeating its price patterns from the past that were preceded by relatively similar events (invalidation of the breakout to new all-time highs – just like in 2008; similarity with regard to price moves, volume, and key indicators – just like in 2011-2012).
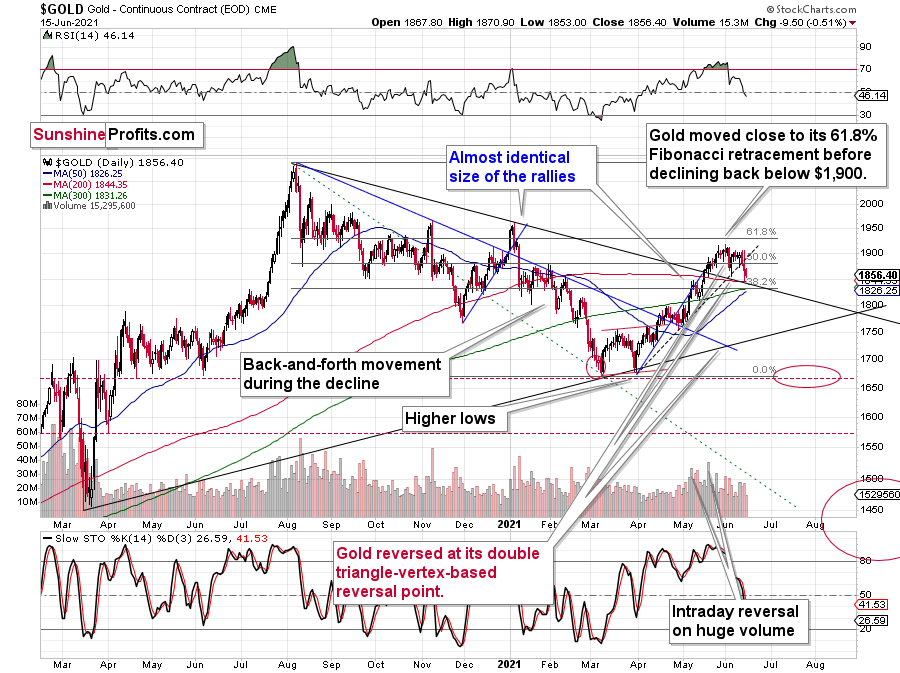
Gold declined once again today, but since it remains between the declining medium-term support line and the rising short-term resistance line, the tug-of-war between bulls and bears remains in place.
The above chart is likely either perplexing, confusing or appearing random for those who haven’t stumbled upon the technical analysis toolkit. But to those who have learned about its principles and have used it themselves, the above chart is very exciting. And to those who took the expertise to the next level and see an even bigger picture, the chart is relatively calm, and normal.
Gold: How exciting are recent moves?
Why would the above chart be so exciting? Because gold just broke below its rising dashed support line and closed the day below it. This is the first time that it managed to do that, despite coming close to it a few times before. The excitement is even bigger because of what happened on an intraday basis – gold moved back to its declining support line based on the 2020 and 2021 highs and then it moved back up. Consequently, based on the same session, both bulls and bears have an indication that “they were right all along”. Was yesterday’s session a major breakdown, or a confirmation of the May breakout?
But how excited can you get if it’s clear that gold is simply repeating its price patterns from the past that were preceded by relatively similar events (invalidation of breakout to new all-time highs – just like in 2008; similarity with regard to price moves, volume, and key indicators – just like in 2011-2012).
Watching a football match is not as exciting when you already know the outcome, is it?
What’s likely to happen now? Gold is likely to move back and forth, but will ultimately break below the declining support line, which will be a major “uh-oh” moment for those who think that gold will move higher from here based on the very positive fundamental situation. Yes, it is very positive, but it doesn’t mean that gold would rally right away. It could decline despite the fundamentals, just like it did in 2008 and in 2013. And it seems that it’s about to slide.
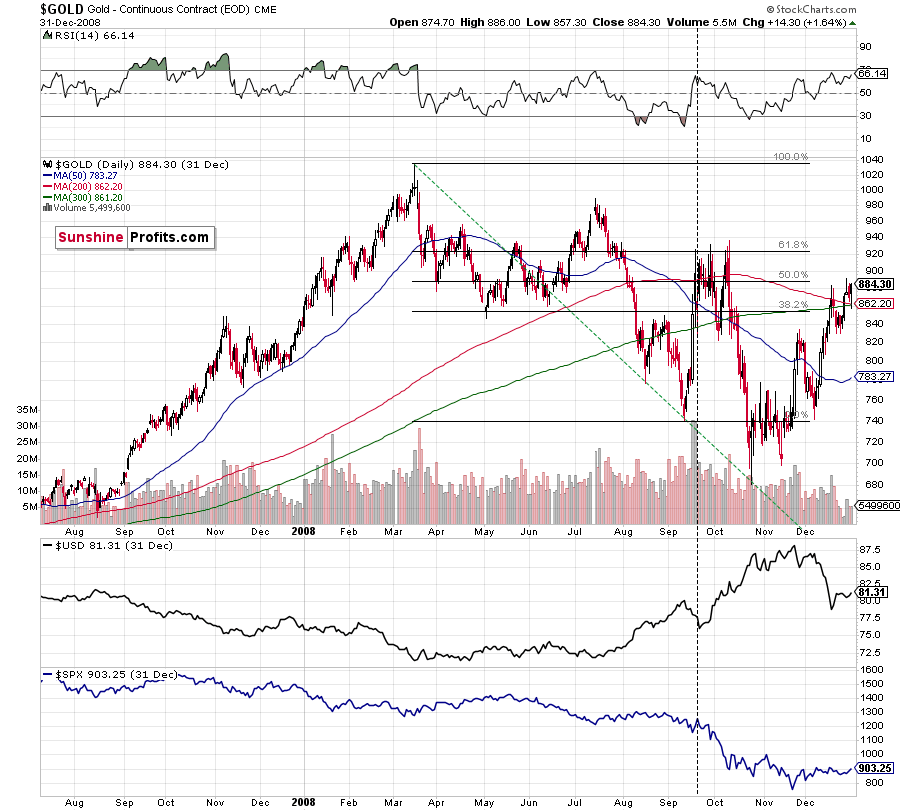
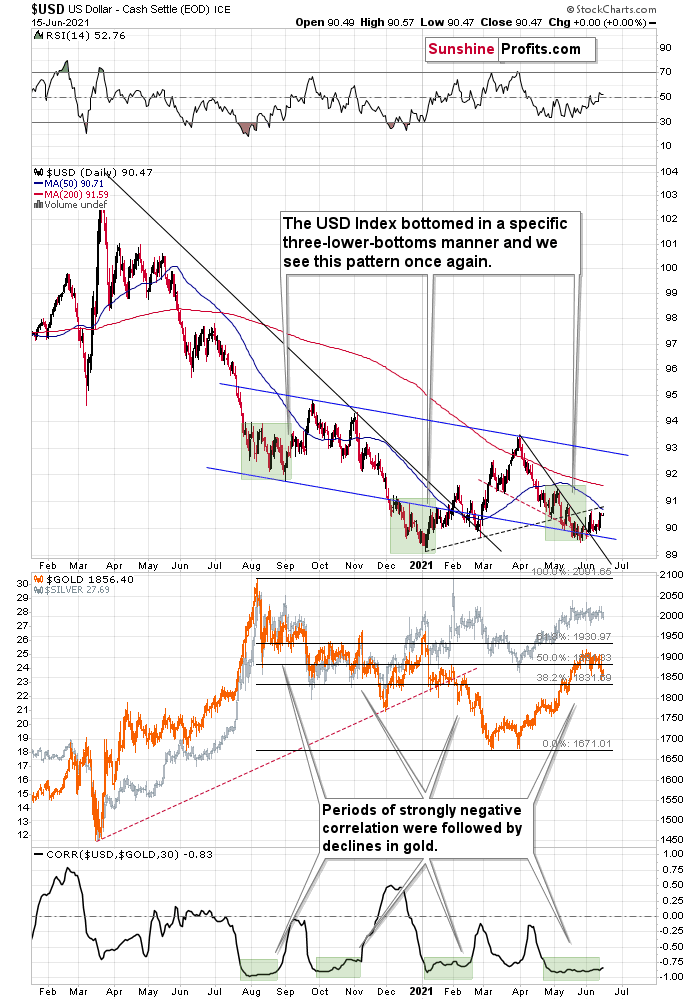
Back in 2008, gold corrected to 61.8% Fibonacci retracement, but it stopped rallying approximately when the USD Index started to rally, and the general stock market accelerated its decline.
Taking into consideration that the general stock market has probably just topped, and the USD Index is about to rally, then gold is likely to slide for the final time in the following weeks/months. Both above-mentioned markets support this bearish scenario and so do the self-similar patterns in terms of gold price itself.
Moreover, while the pace of gold’s decline in 2012 started off slow, the momentum picked up later on as the drawdown became more vicious. As a result, the tepid pace of gold’s current slide remains deceptive and isn’t a cause for concern.
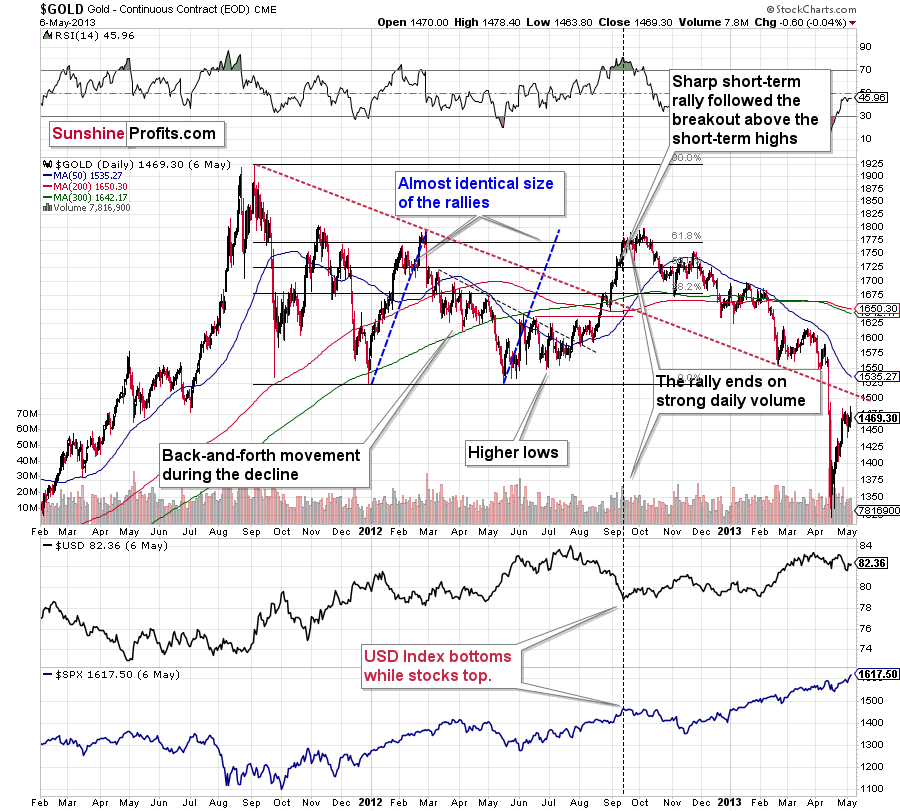
The relatively broad bottom with higher lows is what preceded both final short-term rallies – the current one, and 2012 one. Their shape as well as the shape of the decline that preceded these broad bottoms is very similar. In both cases, the preceding decline had some back-and-forth trading in its middle, and the final rally picked up pace after breaking above the initial short-term high.
Interestingly, the 2012 rally ended on huge volume, which is exactly what we saw also on May 19 this year. Consequently, forecasting much higher gold prices here doesn’t seem to be justified based on the historical analogies.
The thing I would like to emphasize here is that gold didn’t form the final top at the huge-volume reversal on Sep. 13, 2012. It moved back and forth for a while and moved a bit above that high-volume top, and only then the final top took place (in early October 2012).
The same happened in September and in October 2008. Gold reversed on huge volume in mid-September, and it was approximately the end of the rally. The final top, however, formed after some back-and-forth trading and a move slightly above the previous high.
Consequently, the fact that gold moved a bit above its own high-volume reversal (May 19, 2021) is not an invalidation of the analogy, but rather its continuation.
The lower part of the above chart shows how the USD Index and the general stock market performed when gold ended its late-2012 rally and was starting its epic decline. In short, that was when the USD Index bottomed, and when the general stock market topped.
Also, please note that while it might seem bullish that gold managed to rally above its declining black resistance line recently (the one based on the 2020 top and the 2021 top), please note that the same happened in 2012 – I marked the analogous line with red. The breakout didn’t prevent gold from sliding. When the price reached the line, we saw a short-term bounce, but nothing more than that – the gold price fell through it in the following weeks. Consequently, if history rhymes, the support provided by the current declining medium-term support line is unlikely to trigger anything more than a short-term bounce. And since we’re already after this event, gold’s next attempt to break below it might be successful.
Having said that, let’s take a look at silver.
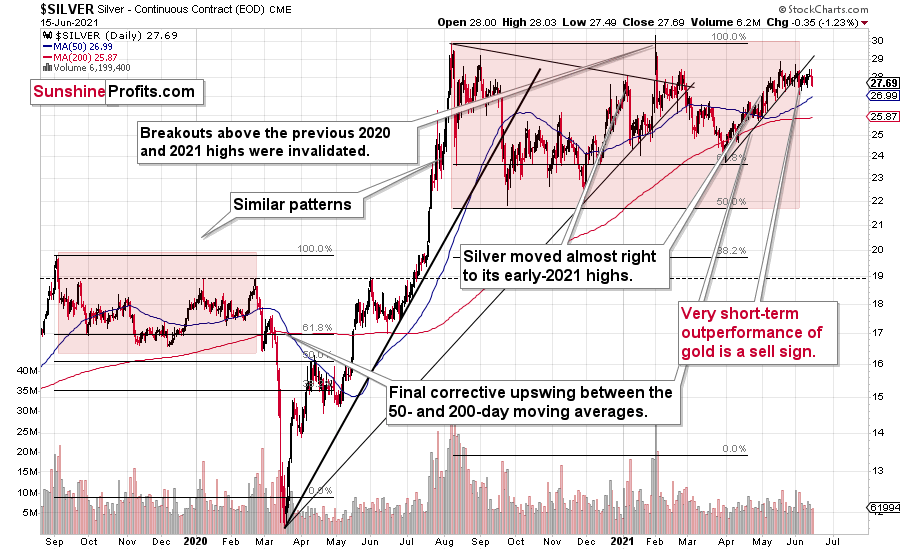
Silver’s failed attempts to break out
Silver price confirmed its breakdown below its rising support line, and it has just finished invalidating its fifth attempt to break above the early January highs. This is a clearly bearish combination, even without taking into account the similarity between now, 2020, and 2008.
Let’s keep in mind that silver might hesitate to decline substantially at first, but then play a huge catch-up close to the end of the decline – just as it did in 2020.
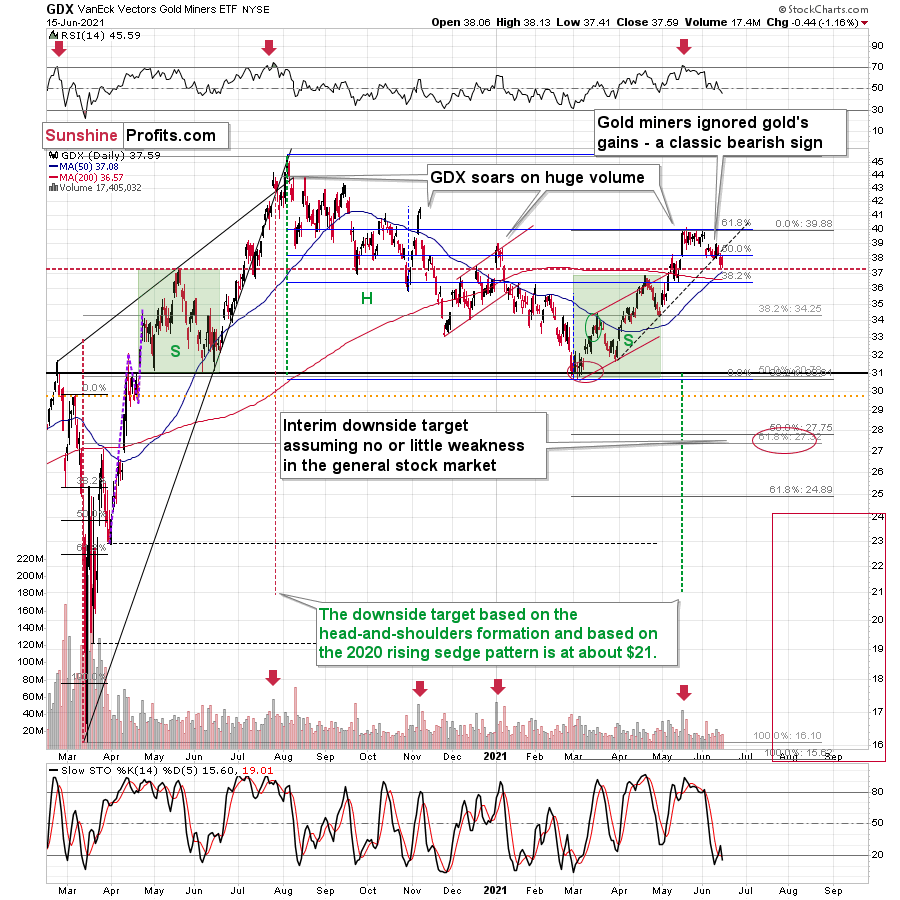
Miners: Breaking below support lines without USDX help
The breakdown in the GDX ETF is also crystal clear. Moreover, it’s almost confirmed, as the GDX ETF closed below its rising dashed support line for the second day in a row.
We saw a buy signal from the stochastic indicator, but the breakdown in terms of closing prices is more important, as the buy signals from the stochastic (below 20) were not that reliable so far this year. Please note that the mid-January buy signal was followed by much lower prices in the following weeks. The same was the case with the first buy signal that we saw in late February.
And indeed, the supposedly bullish signal has already been reversed by another sell signal. Thus, the trend remains down and the outlook remains bearish.
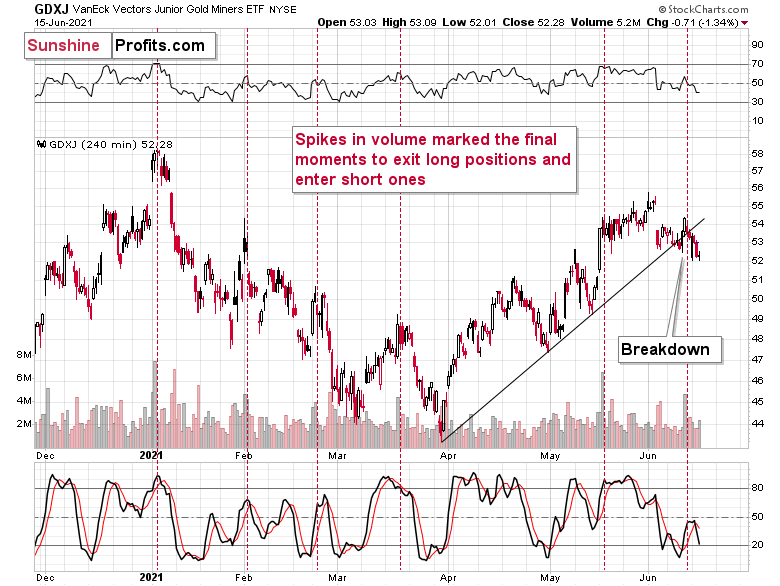
The breakdown is also clear in the case of the 4-hour chart featuring the proxy for junior miners – the GDXJ ETF.
On the above chart, we see that the huge-volume rally has once again worked as a sell signal – in the past, it often heralded short-term declines like the current one.
What’s particularly interesting, gold and gold miners have broken decisively below their rising support lines without the USD Index’s help. This is a sign of weakness in the PMs market.
Want free follow-ups to the above article and details not available to 99%+ investors? Sign up to our free newsletter today!
Want free follow-ups to the above article and details not available to 99%+ investors? Sign up to our free newsletter today!
Author

Przemyslaw Radomski, CFA
Sunshine Profits
Przemyslaw Radomski, CFA (PR) is a precious metals investor and analyst who takes advantage of the emotionality on the markets, and invites you to do the same. His company, Sunshine Profits, publishes analytical software that any


