Gold Price Weekly Forecast: XAU/USD bulls bet on Golden Cross pattern, uptrend support, lower yields
- Gold's price has been holding above $1,800, but moving higher has been challenging.
- Inflation data and fluctuations in US yields are eyed.
- Mid-July's daily chart is painting a bullish picture.
- The FX Poll is pointing to further trading around current levels.

When will gold unchain itself from the $1,800 level? XAU/USD has shown a tendency to cling to that round level, and traders are asking what is next. The charts are pointing to further gains, and critical US data is set to influence as well.
This week in XAU/USD: Lower US yields are not enough
US bond yields have plunged in the past week, perplexing many investors and supporting gold prices. Some explain the increase by pointing to fears of the Delta covid variant that would knock down the recovery, at least temporarily. Others point to a short-lived pause in the issuance of new bonds.
Lower returns on safe US debt make the yieldless precious metal more attractive, yet the correlation between both asset classes – as well as that with the dollar – has eroded. When yields finally advanced late in the week, XAU/USD received a small boost.
Regulatory impact also seemed to be minimal. Basel III rules were introduced in some jurisdictions, and they reclassify what paper gold means for banks' balance sheets. Financial institutions may only count physical bars and coins as top-tier collateral, while indirect holdings were downgraded.
There are two solutions – either ditching such indirect holdings and pushing prices lower or swapping them for the real thing, boosting the value of the yellow metal. After over a week, it seems that there has been no adverse effect on gold prices, leaving other factors to influence XAU/USD price action..
Next week in gold: Inflation in focus
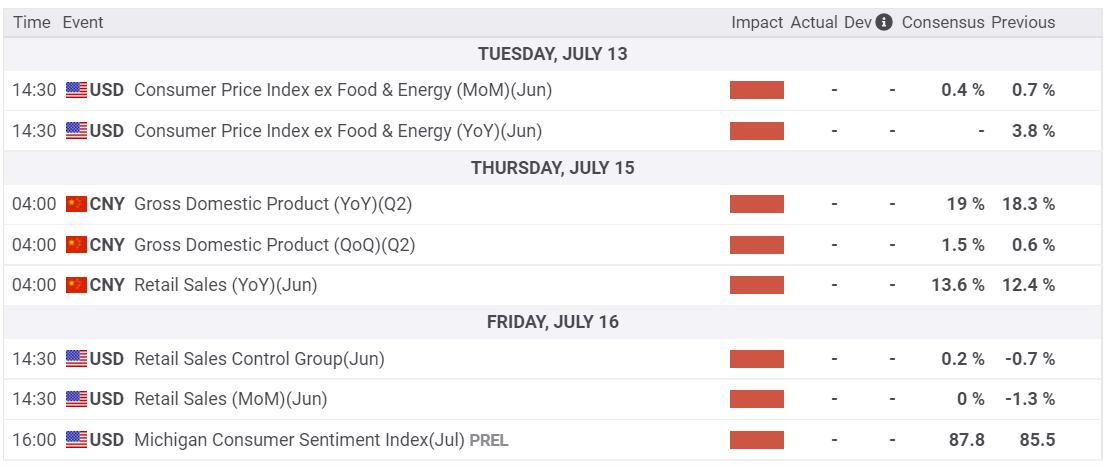
Has US inflation accelerated? That is the main question for broad markets and gold. If the Core Consumer Price Index (Core CPI) rose in June above 4%, it could push the Federal Reserve to tighten its policy sooner rather than later, beginning by printing fewer dollars. A taper of the bank's bond-buying scheme could put pressure on gold.
On the other hand, inflation may have peaked last month – perhaps due to diminishing base effects, the sharp fall in prices seen in the spring of 2020. In that case, the Fed would feel comfortable purchasing $120 billion in bonds for longer. Some of that money could make its way to the precious metal.
Other events to keep an eye on are Chinese growth figures for the second quarter and US retail sales statistics for June. China is the world's second-largest economy, and the US is No. 1 – with the latter's economy heavily dependent on production in the former. In general, better figures from both sides of the Pacific could cheer investors, supporting gold prices. Disappointing data could weigh on XAU/USD.
Here are the key events for gold on the economic calendar:
XAU/USD technical analysis
A Golden Cross in Gold – the 50-day Simple Moving Average (SMA) has crossed the 200-day SMA to the upside, creating this bullish technical pattern. While XAU/USD still trades below both SMAs and momentum is to the downside, it is cushioned by an uptrend support line that has accompanied the metal since the trough of April 2020. Moreover, it has been setting higher highs and higher lows in the past few months.
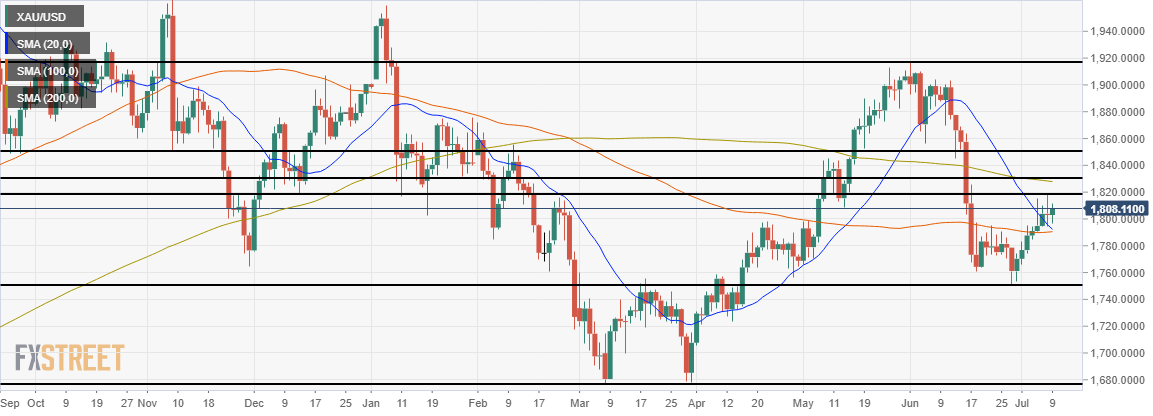
Gold price: Daily chart
Some resistance awaits at $1,819, the July high. It is followed by the $1,830 region, where the two SMAs nearly meet. Further above, $1,850 and $1,919 are the next lines to watch.
Strong support is at $1,750, which kept XAU/USD from falling twice in recent months. Another double-bottom awaits gold at $1,678. Further down, $1,565 is another noteworthy level.
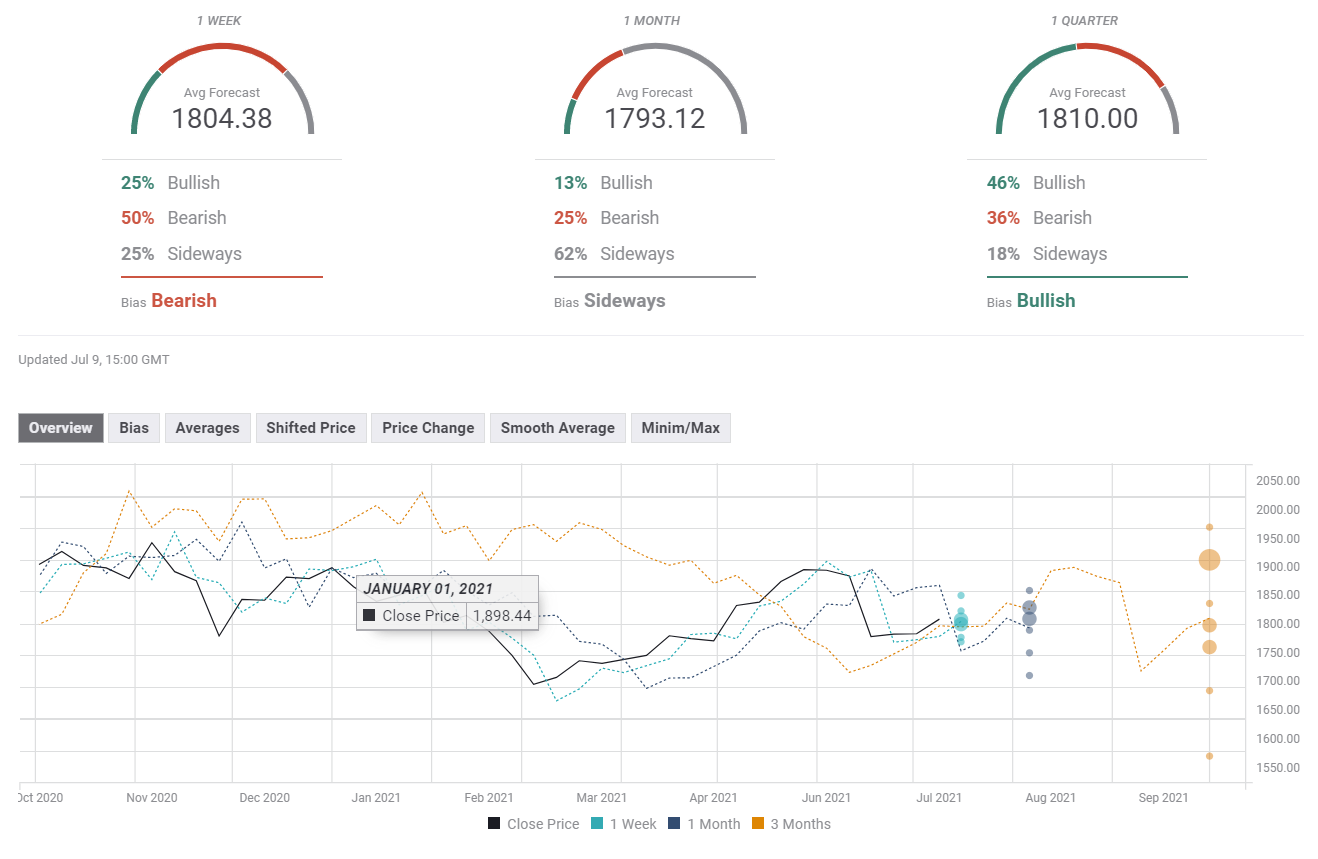
Gold sentiment
Bullish technicals and potentially lower yields due to a peak in inflation could keep gold bid and help it lift off from the $1,800 "magnet."
The FX Poll is showing that experts expect XAU/USD to cling onto $1,800 in the foreseeable future. Compared to the previous week, the short and long term forecasts, while they project a medium-term slide.
Related Reads
Author

Yohay Elam
FXStreet
Yohay is in Forex since 2008 when he founded Forex Crunch, a blog crafted in his free time that turned into a fully-fledged currency website later sold to Finixio.


