Gold Price Forecast: XAU/USD struggles around $2,325 despite broad US Dollar’s weakness

XAU/USD Current price: $2,326.11
- Disappointing United States PMIs pressured the US Dollar after Wall Street’s opening.
- Market players await the US Gross Domestic Product and an inflation update.
- XAU/USD maintains its bearish tone in the near term, near-term support at $2,310.
Spot Gold trades flat for the day around $2,326, recovering from an intraday low of $2,291.26. XAU/USD fell on the back of a better market mood, keeping the US Dollar on the back against most major currencies. The USD scenario partially changed after the release of discouraging US data, as the preliminary estimates of the April S&P Global PMIs missed the market’s expectations. The Manufacturing PMI shrank to 49.9 from 51.9 in March, while the Services PMI slid to 50.9 from 51.7. The Composite PMI resulted then in 50.9, down from 52.1 in the previous month.
Wall Street shrugged off the dismal figures and maintained a positive tone, but market players decided to sell the USD. Soft growth-related data may force the Federal Reserve (Fed) to trim interest rates sooner rather than later, somehow backing the better tone of equities.
Critical United States (US) data will be released later in the week. The country will unveil the first estimate of the Q1 Gross Domestic Product (GDP) next Thursday, and is expected to show the economy grew at an annualized pace of 2.5% in the three months to March. Also, the US will publish the March Personal Consumption Expenditures (PCE) Price Index on Friday, the Federal Reserve’s (Fed) favorite inflation gauge. The report will lose some of its usual relevance after the GDP data release, which includes a quarterly PCE Price Index estimate, but could still anticipate the Fed’s course.
XAU/USD short-term technical outlook
From a technical point of view, XAU/USD seems poised to extend its slide. It’s currently battling with the 23.6% Fibonacci retracement of the $1,996.06/$2,431.43 rally, unable to recover above the level clearly. Furthermore, the daily chart shows technical indicators maintain uneven downward slopes near their midlines, still retreating from extreme overbought readings. At the same time, XAU/USD remains above bullish moving averages, with the 20 SMA providing near-term support at around $2,310.
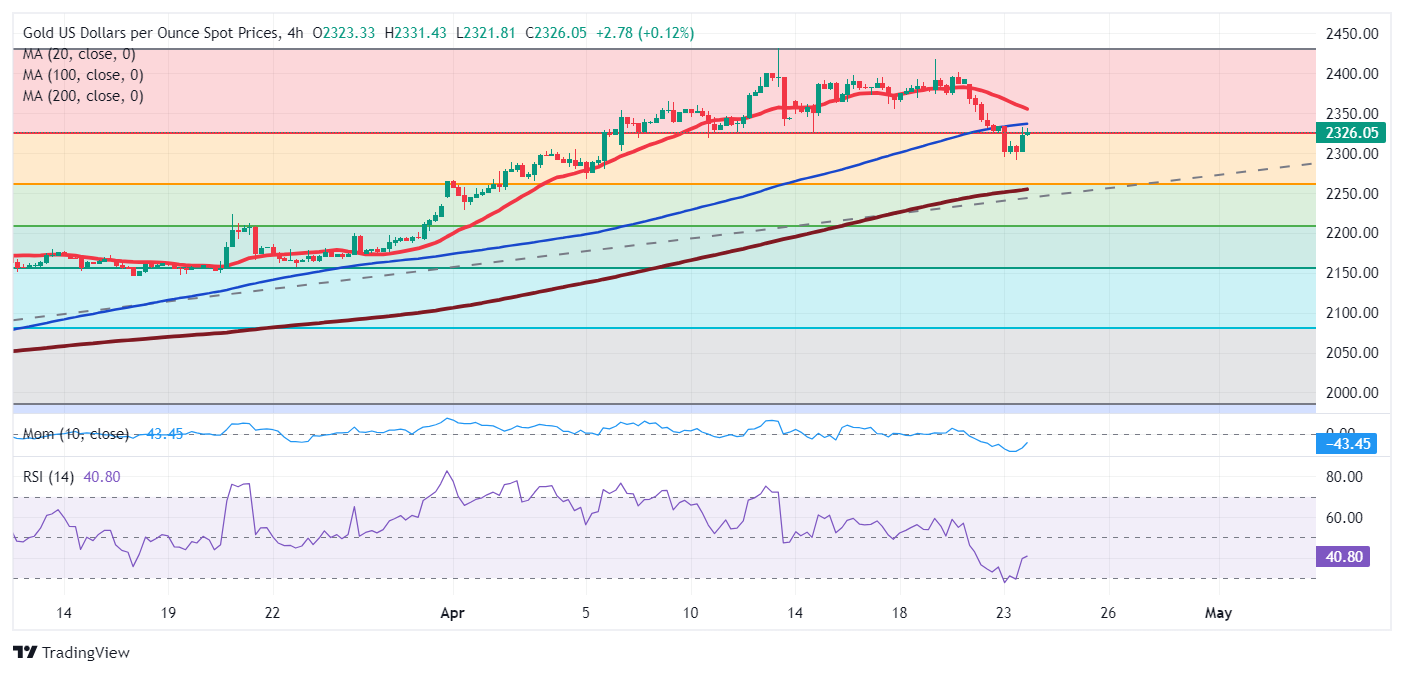
In the near term, and according to the 4-hour chart, the risk skews to the downside. A mildly bullish 100 SMA limits intraday advances, while the 20 SMA gains downward traction above the longer one. At the same time, technical indicators corrected from oversold readings before resuming their slides within negative levels.
Support levels: 2,310.00 2,295.20 2,282.90
Resistance levels: 2,348.30 2,361.55 2,372.90
Premium
You have reached your limit of 3 free articles for this month.
Start your subscription and get access to all our original articles.
Author

Valeria Bednarik
FXStreet
Valeria Bednarik was born and lives in Buenos Aires, Argentina. Her passion for math and numbers pushed her into studying economics in her younger years.


