Gold Price Forecast: XAU/USD resumes advance after reconquering $2,400

XAU/USD Current price: $2,418.90
- The mood improved after the United States published encouraging employment figures.
- Concerns about Federal Reserve’s interest rate cuts remain in the background.
- XAU/USD trades with a firmer tone and may extend its advance once beyond $2,424.
Spot Gold is on the run after recovering the $2,400 mark, peaking at $2,424.01 in the American trading session. The bright metal surged as encouraging United States (US) data brought some relief to financial markets, weighing on US Dollar demand. The Greenback, however, is firmer against the Swiss Franc (CHF) and neutral against the Japanese Yen (JPY).
Wall Street trimmed early gains and trades with a firm tone following the release of Initial Jobless Claims, which decreased to 233K from a previously revised 250K, also better than the 240K anticipated. In the absence of major news, the encouraging figure underpinned the mood and helped US indexes reverse most of their Wednesday losses.
Gold’s advantage could be understood by persistent speculation the US Federal Reserve (Fed) will deliver more aggressive rate cuts than previously estimated. A few months ago, speculative interest was considering one timid cut before year-end, with limited hopes for a second one. However, the latest macroeconomic data suggesting the economy could face a recession spurred speculation of potential three cuts before year-end. Even further, market participants are starting to believe the Fed could trim rates before the upcoming September meeting in an out-of-schedule move.
Today’s employment-related data spurred some optimism, but it seems pretty irrelevant when compared to the tepid Nonfarm Payrolls (NFP) report released last Friday, partially responsible for the latest panic trading. Overall, it seems that speculative interest has finally priced in more aggressive rate cuts and is now waiting for the next catalyst.
XAU/USD short-term technical outlook
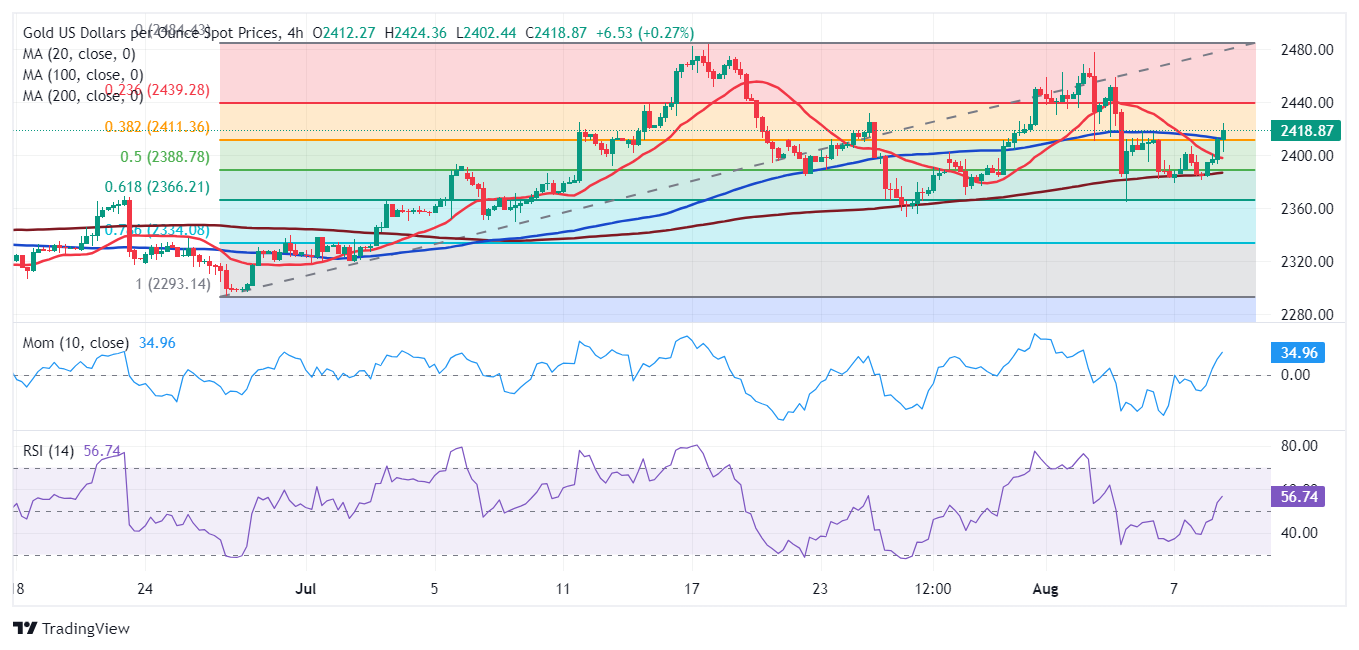
XAU/USD is firmly up after closing in the red for five consecutive days but is still confined within Fibonacci levels. The pair is currently trading around the 38.2% retracement of the June/July rally at $2,411.20, an immediate near-term support. The 23.6% retracement provides resistance at $2,438.80.
Meanwhile, technical readings in the daily chart support a bullish extension, particularly if the pair extends its intraday rally before the aforementioned high. Technical indicators have turned firmly north but remain within neutral levels. At the same time, XAU/USD battles a flat 20 Simple Moving Average (SMA) but remains above bullish 100 and 200 SMAs.
Technical readings in the 4-hour chart skew the risk to the upside, but the momentum seems limited. The pair is currently trading above a mildly bearish 100 SMA, while the 20 and 200 SMAs lack directional strength below it. Finally, technical indicators are entering positive ground with modest upward slopes, not enough to confirm another run north.
Support levels: 2,411.20 2,397.90 2,388.10
Resistance levels: 2,424.00 2,438.80 2,452.90
Premium
You have reached your limit of 3 free articles for this month.
Start your subscription and get access to all our original articles.
Author

Valeria Bednarik
FXStreet
Valeria Bednarik was born and lives in Buenos Aires, Argentina. Her passion for math and numbers pushed her into studying economics in her younger years.


